B2B SaaS · Analytics · Founding Designer
Logica: Self-Serve Analytics for Enterprise Data Teams
A single business question could sit in the data team's queue for hours, sometimes days. By the time the SQL ran, the call had already been made without data. Logica is Kubit AI's self-serve analytics platform, and it closed that gap. He designed it from blank page to rollout, including Mika, the AI agent that grounds natural-language answers in metric definitions, dataset windows, and human review states.
- Domain
- B2B SaaS · Self-Serve Analytics · Data Governance
- Deliverables
- Desktop Web App · Design System · Interaction & Visual Design
- Scope
- User Research · UX/UI · Strategy · Prototyping · Launch
- Timeline
- 2018 → 2024 · Discovery → Rollout → Multi-year iteration
Why this was hard
Why a fast answer was a hard answer
Enterprise customers in media, SaaS, and fintech record billions of product events across hundreds of tables. For non-technical PMs and ops leads, getting an answer was slow. Every new question became an ad-hoc SQL request to data engineering, and traditional BI tools crawled on real-time event data. Most “self-serve” tools wanted you to duplicate the data, which broke a zero-ETL approach. Decisions lagged and insights went stale.
The brief I inherited as Founding Designer came with four hard constraints: warehouse-scale data, non-technical users, no SQL exposure, and no compromise on governance. Loosen one and you tighten the rest. None of them could move. Self-serve at this scale had to hold across the dictionary, the editor, roles, and the model layer at the same time.
The org-side constraint mattered just as much. I spent five years as the solo designer supporting a 50-person product team, then coached one junior designer and two interns as the practice grew. The hardest part was never a single screen. It was keeping the system coherent across years of new surfaces, new enterprise customers, and a model layer that didn’t exist when I started.
Trade-off 1
Lite vs Pro modes: one product, two postures
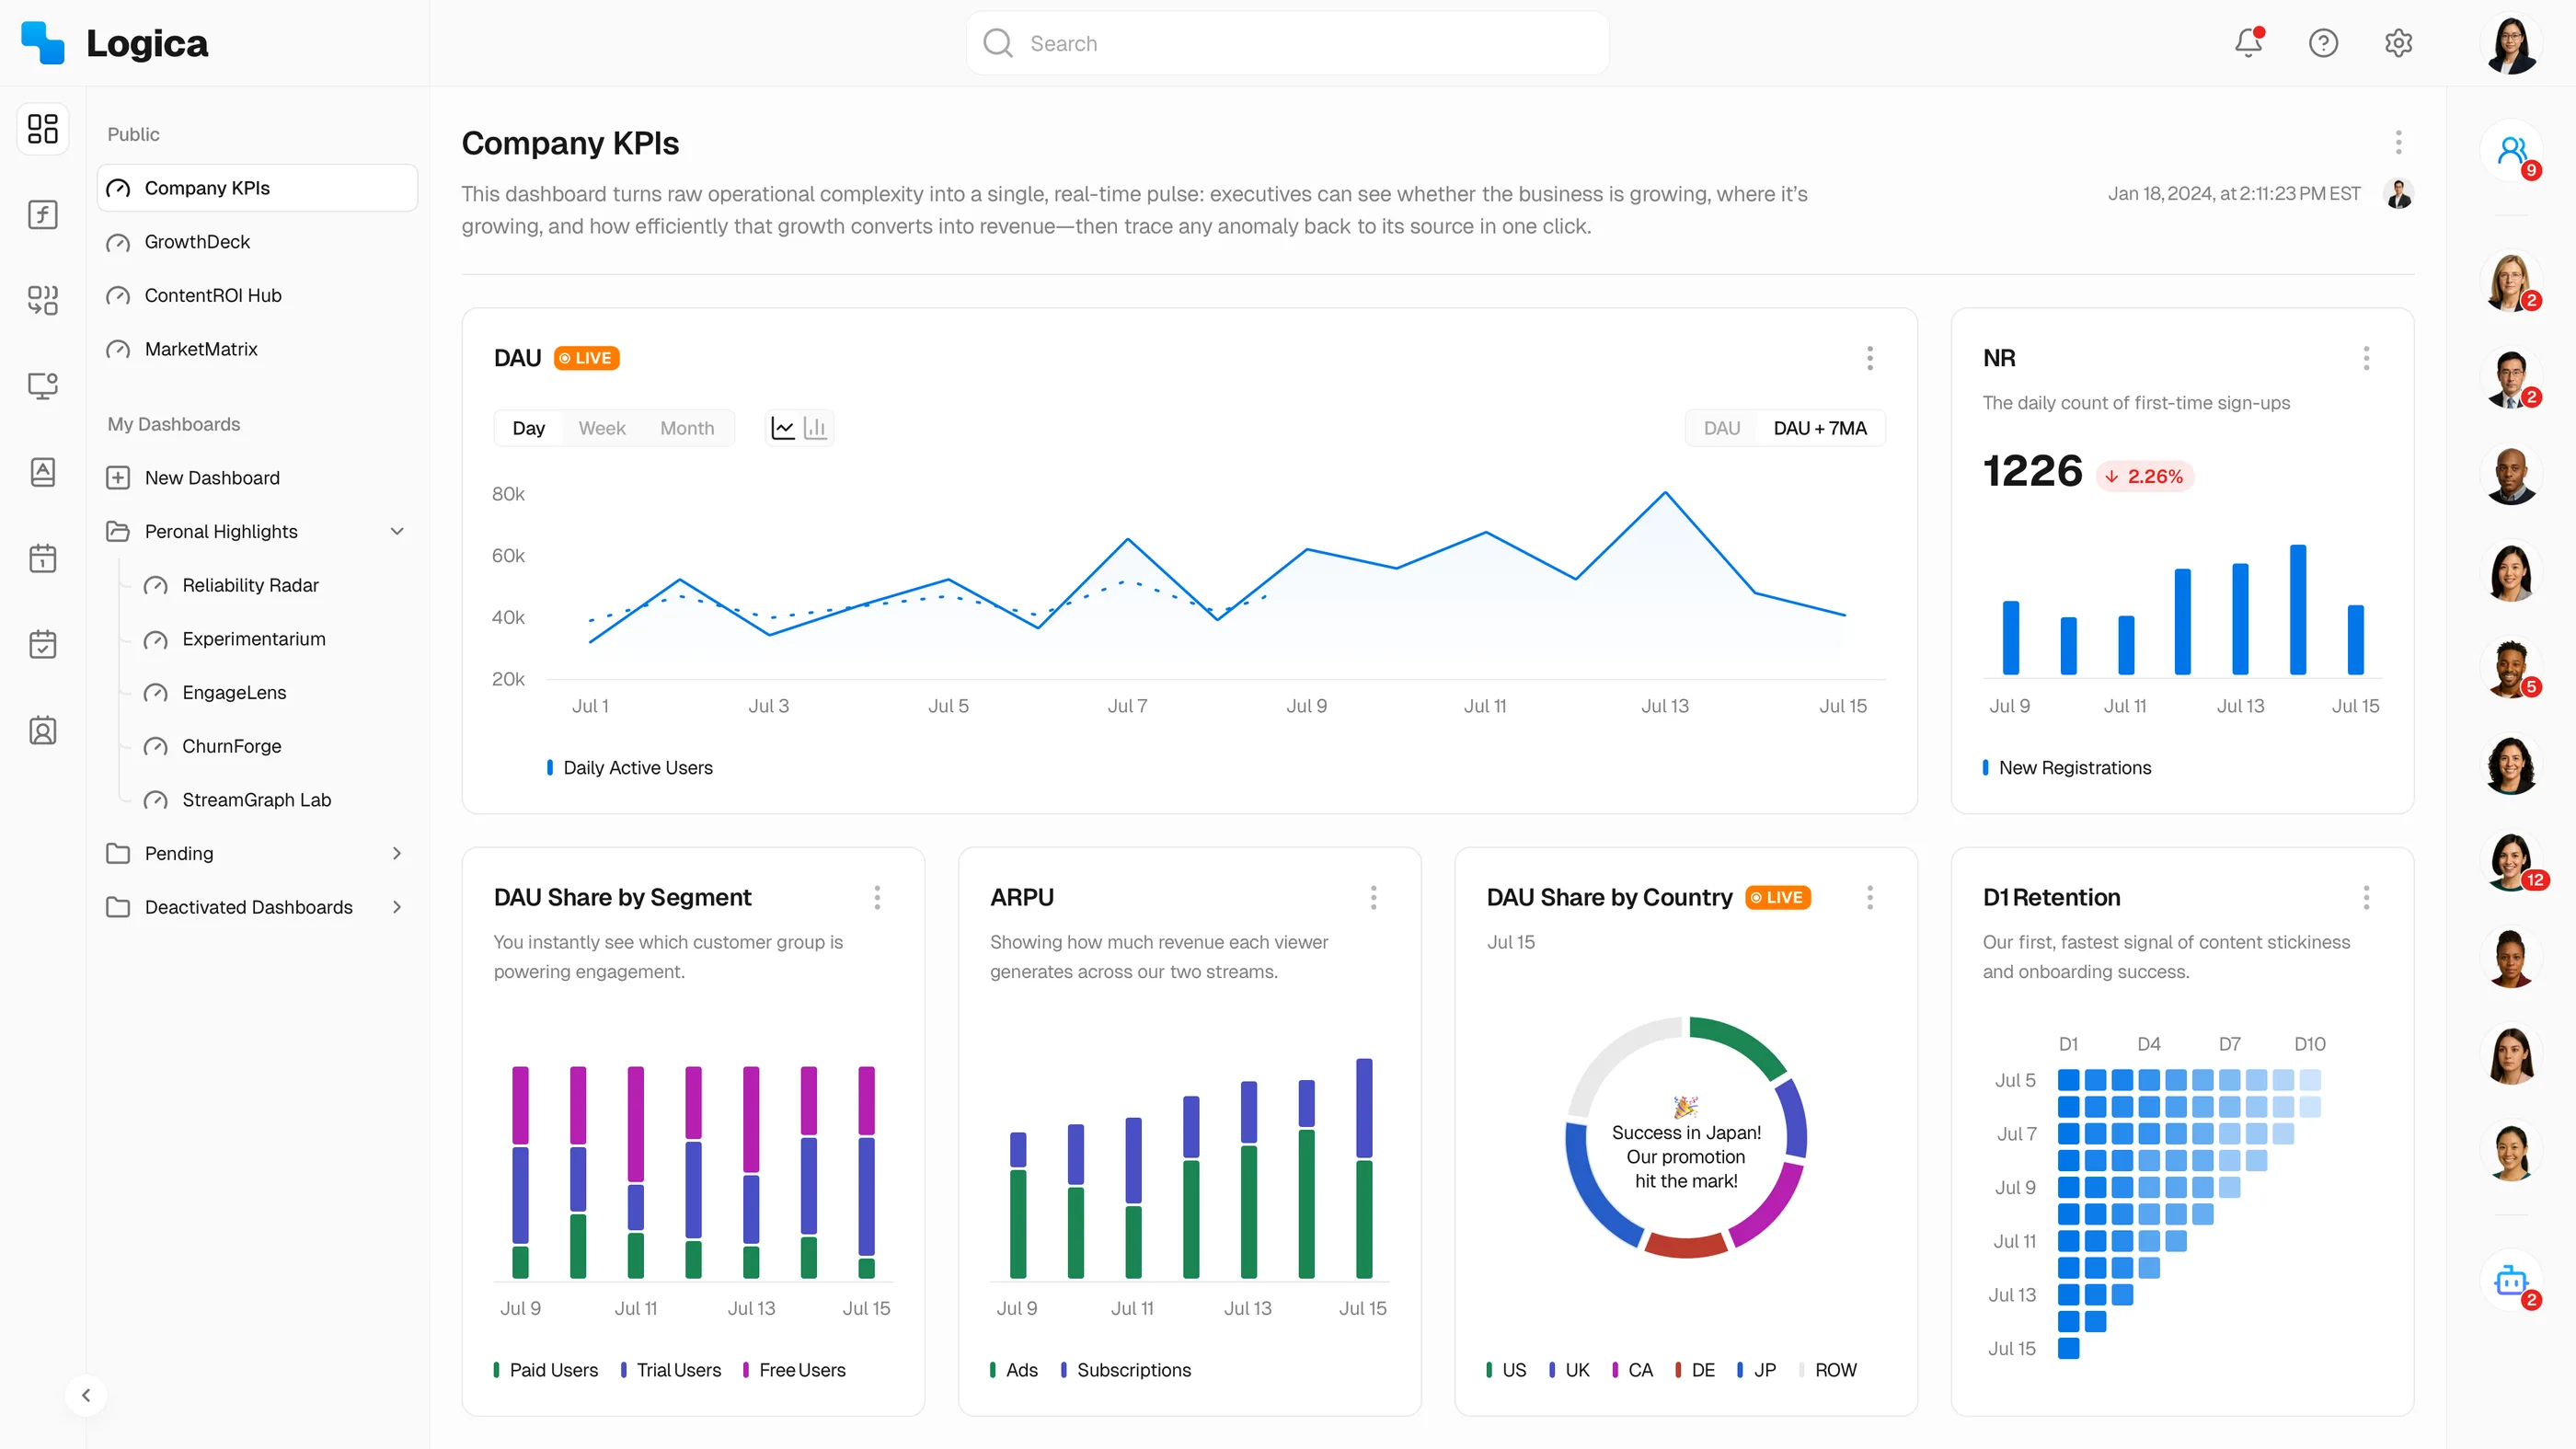
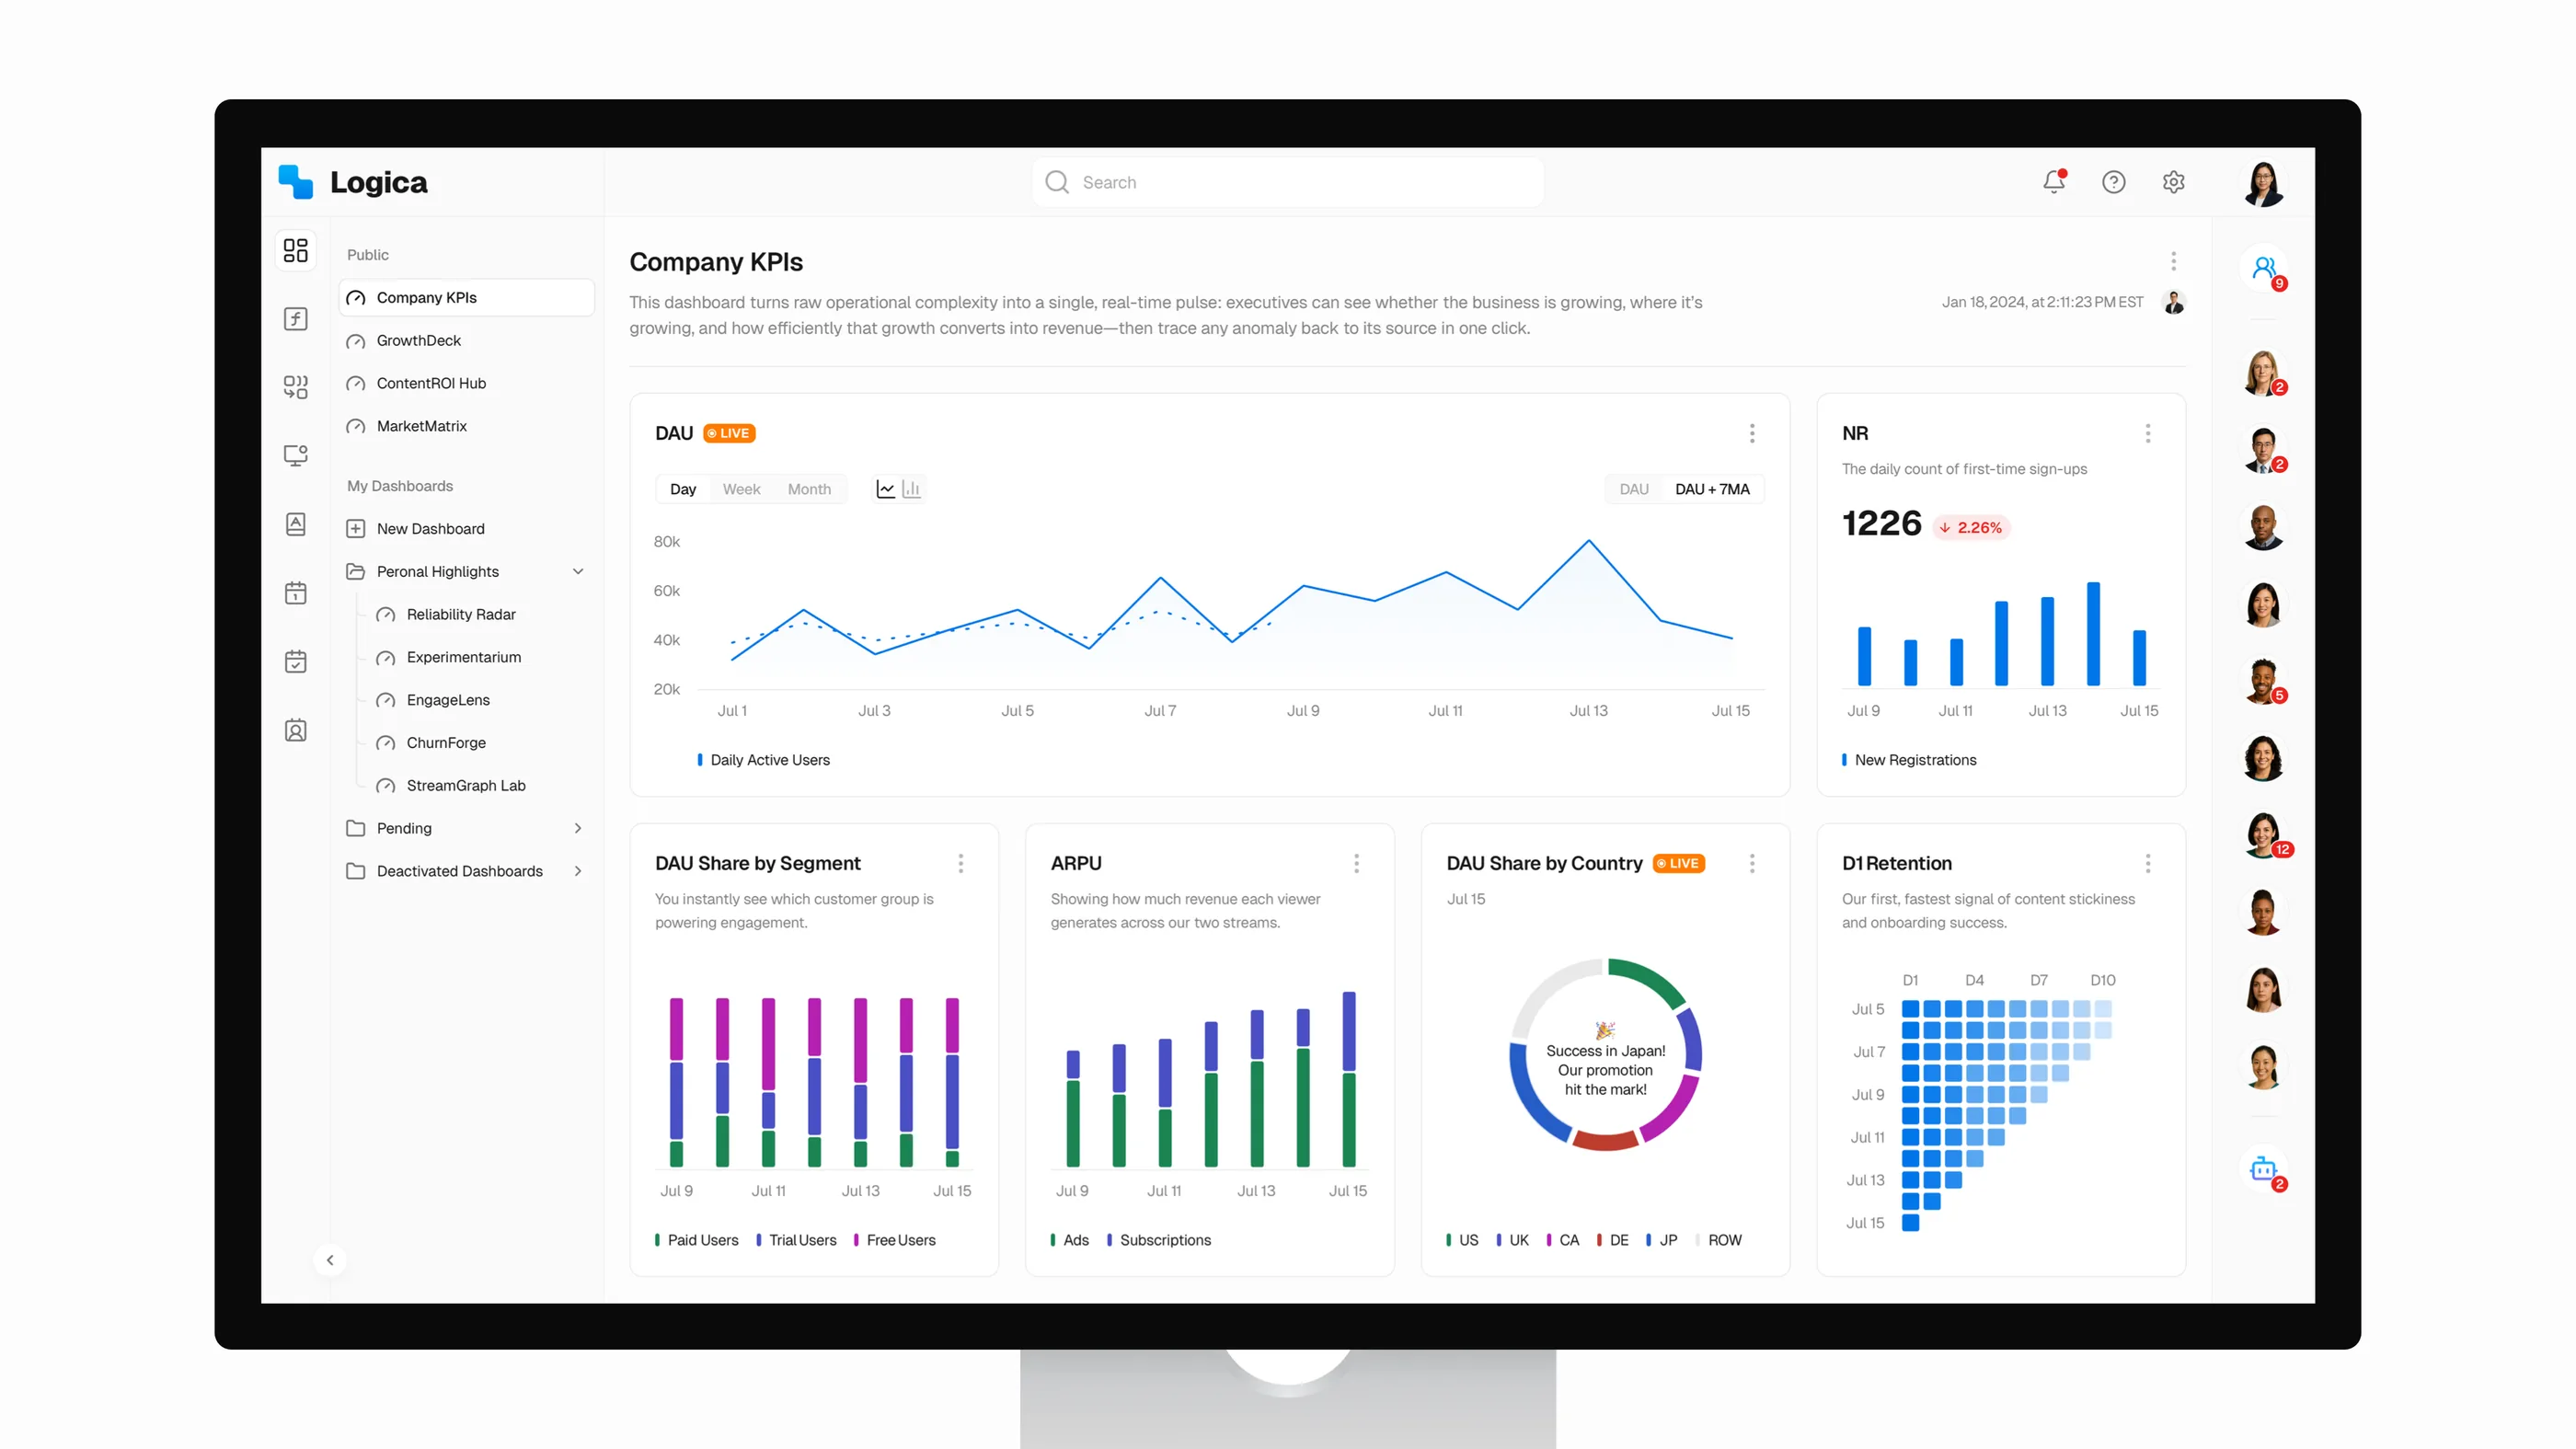
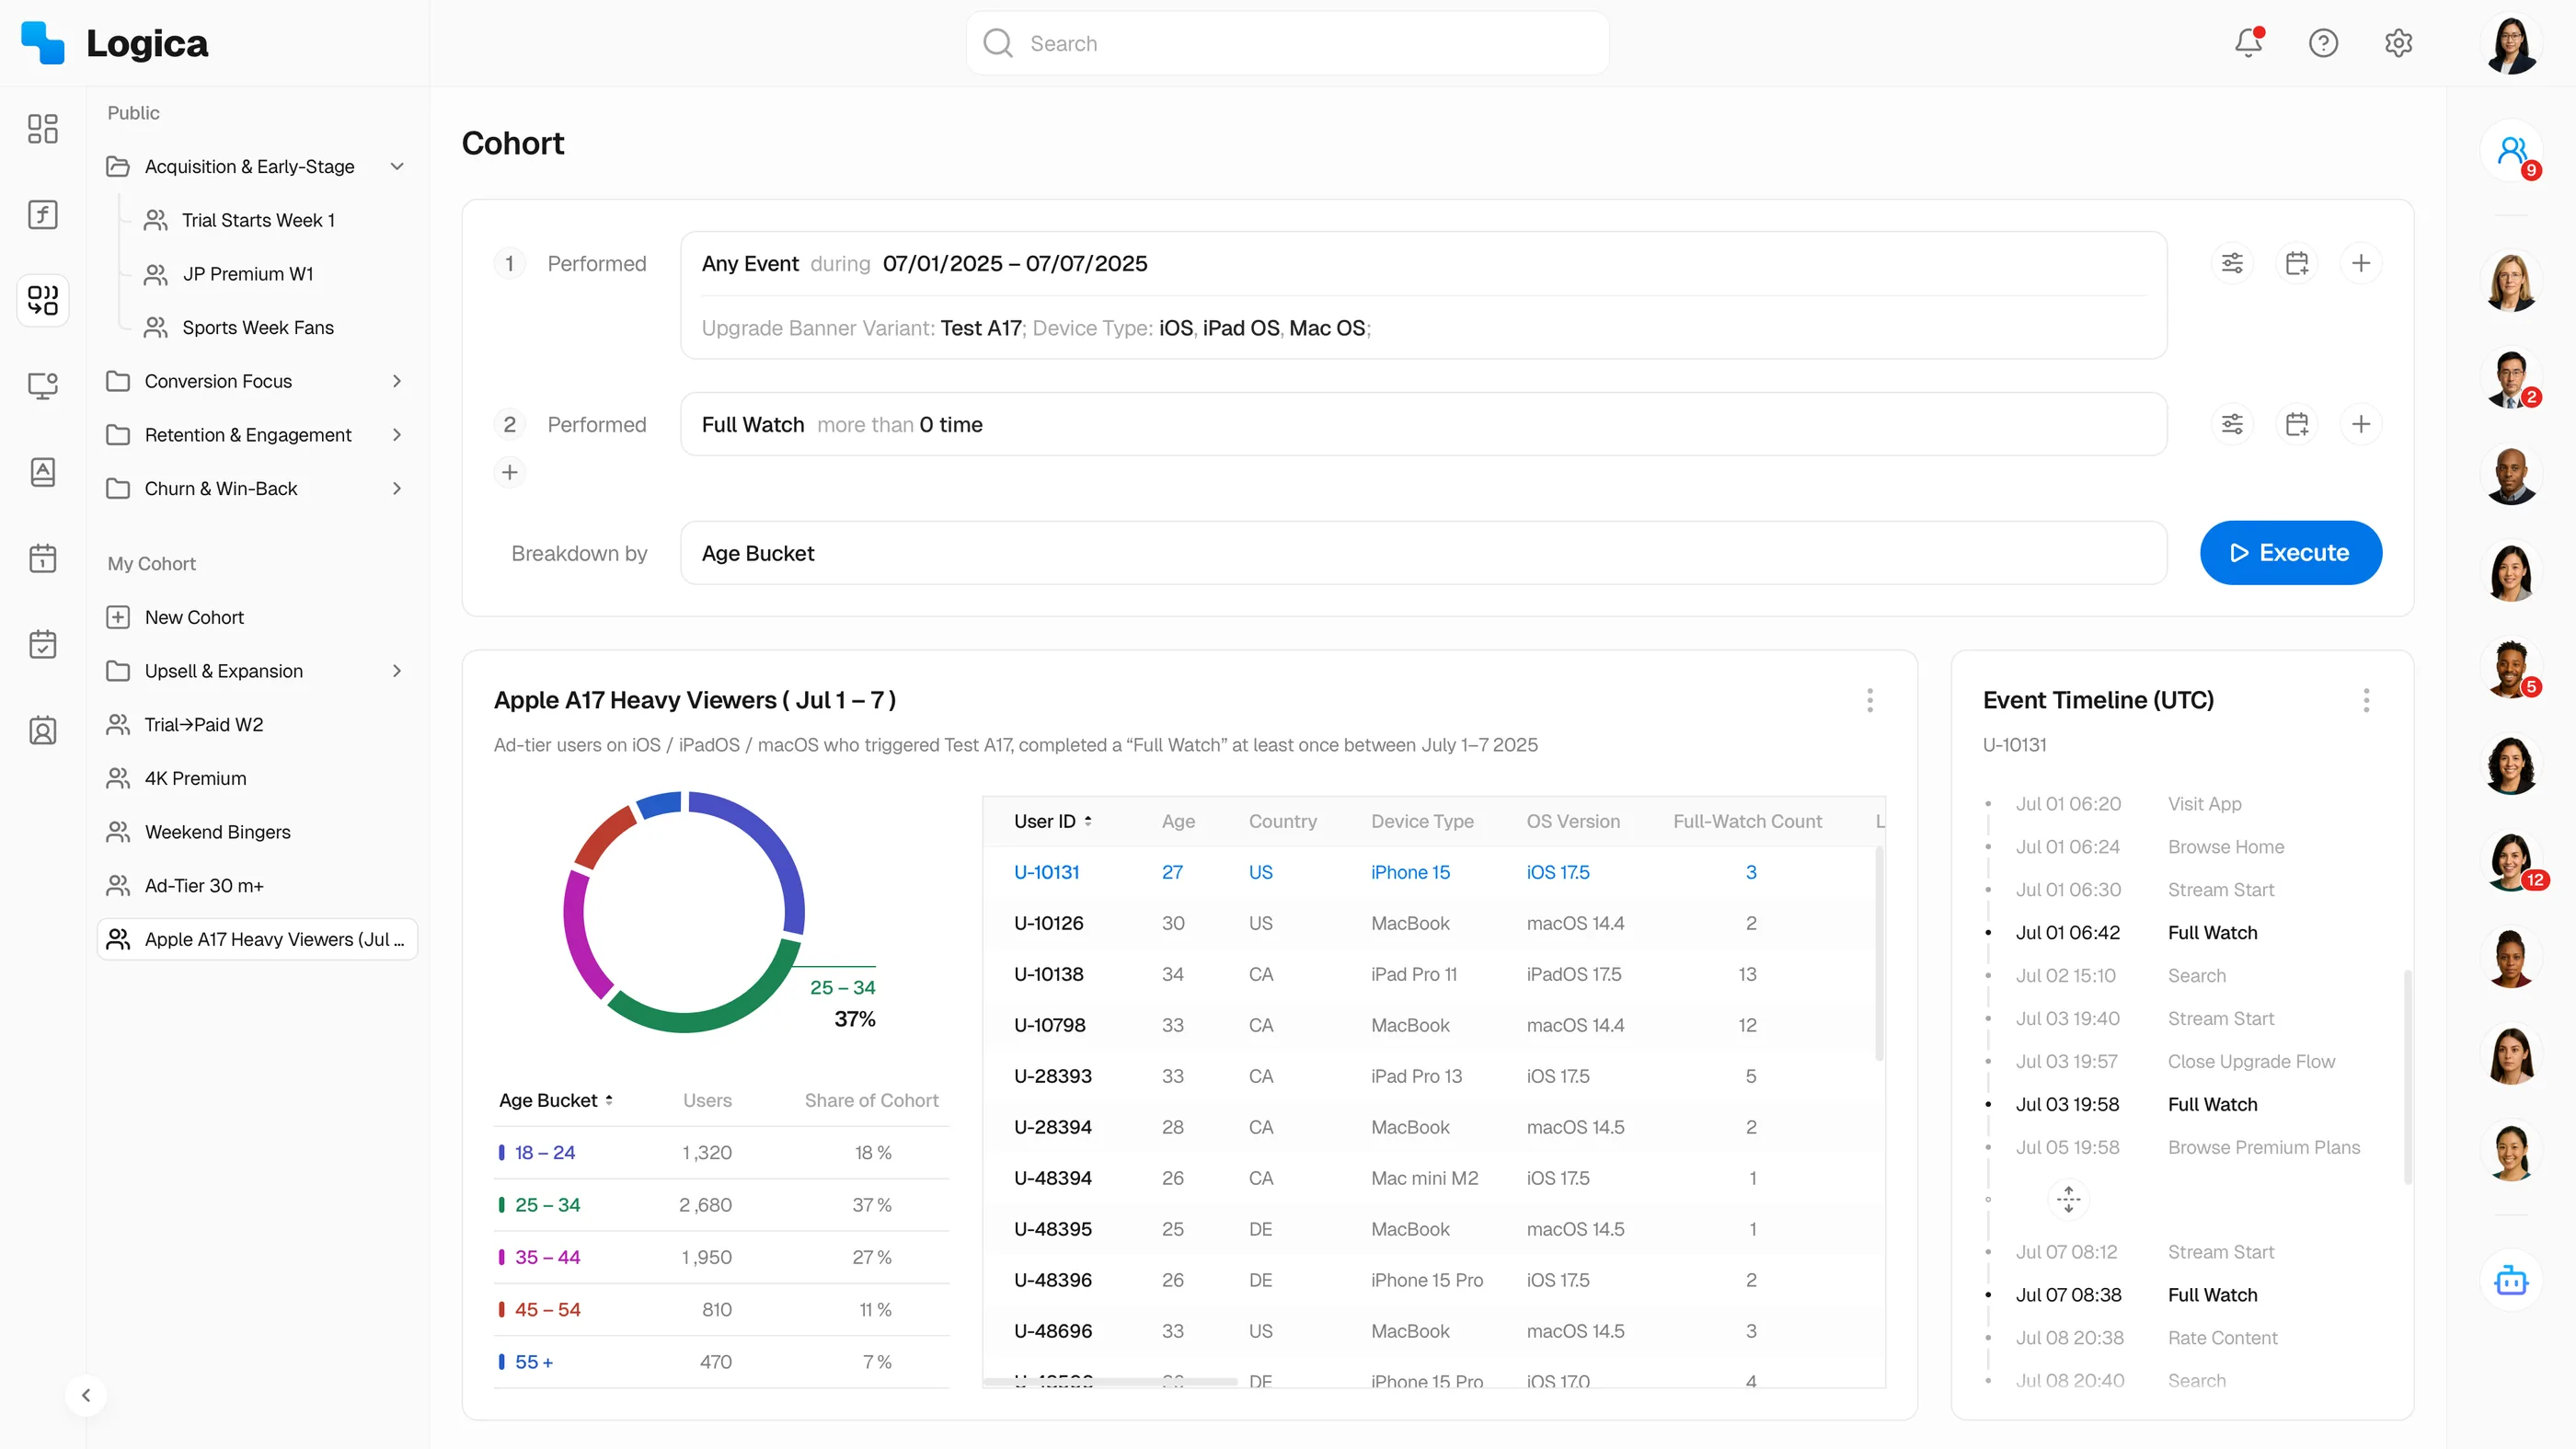
The first call was structural. Separate UIs for separate roles, or one progressive UI that scales with the user. I chose two postures on a shared system. Lite guides PMs and ops leads with templates and a visual builder, so they answer everyday questions without seeing SQL. Pro gives analysts precision controls, custom formulas, and an optional SQL escape hatch. Executives get focused KPI views with one-click drill-downs.
That duality cost us one shared component library and a hard rule against forking the IA, the type ramp, or the form patterns. It paid off. PMs onboarded in minutes. Analysts didn’t feel boxed in. Executives never saw the full surface they didn’t need. A Lite user growing into Pro moves through the product, not into a different product.
Trade-off 2
Designing the formula editor end to end
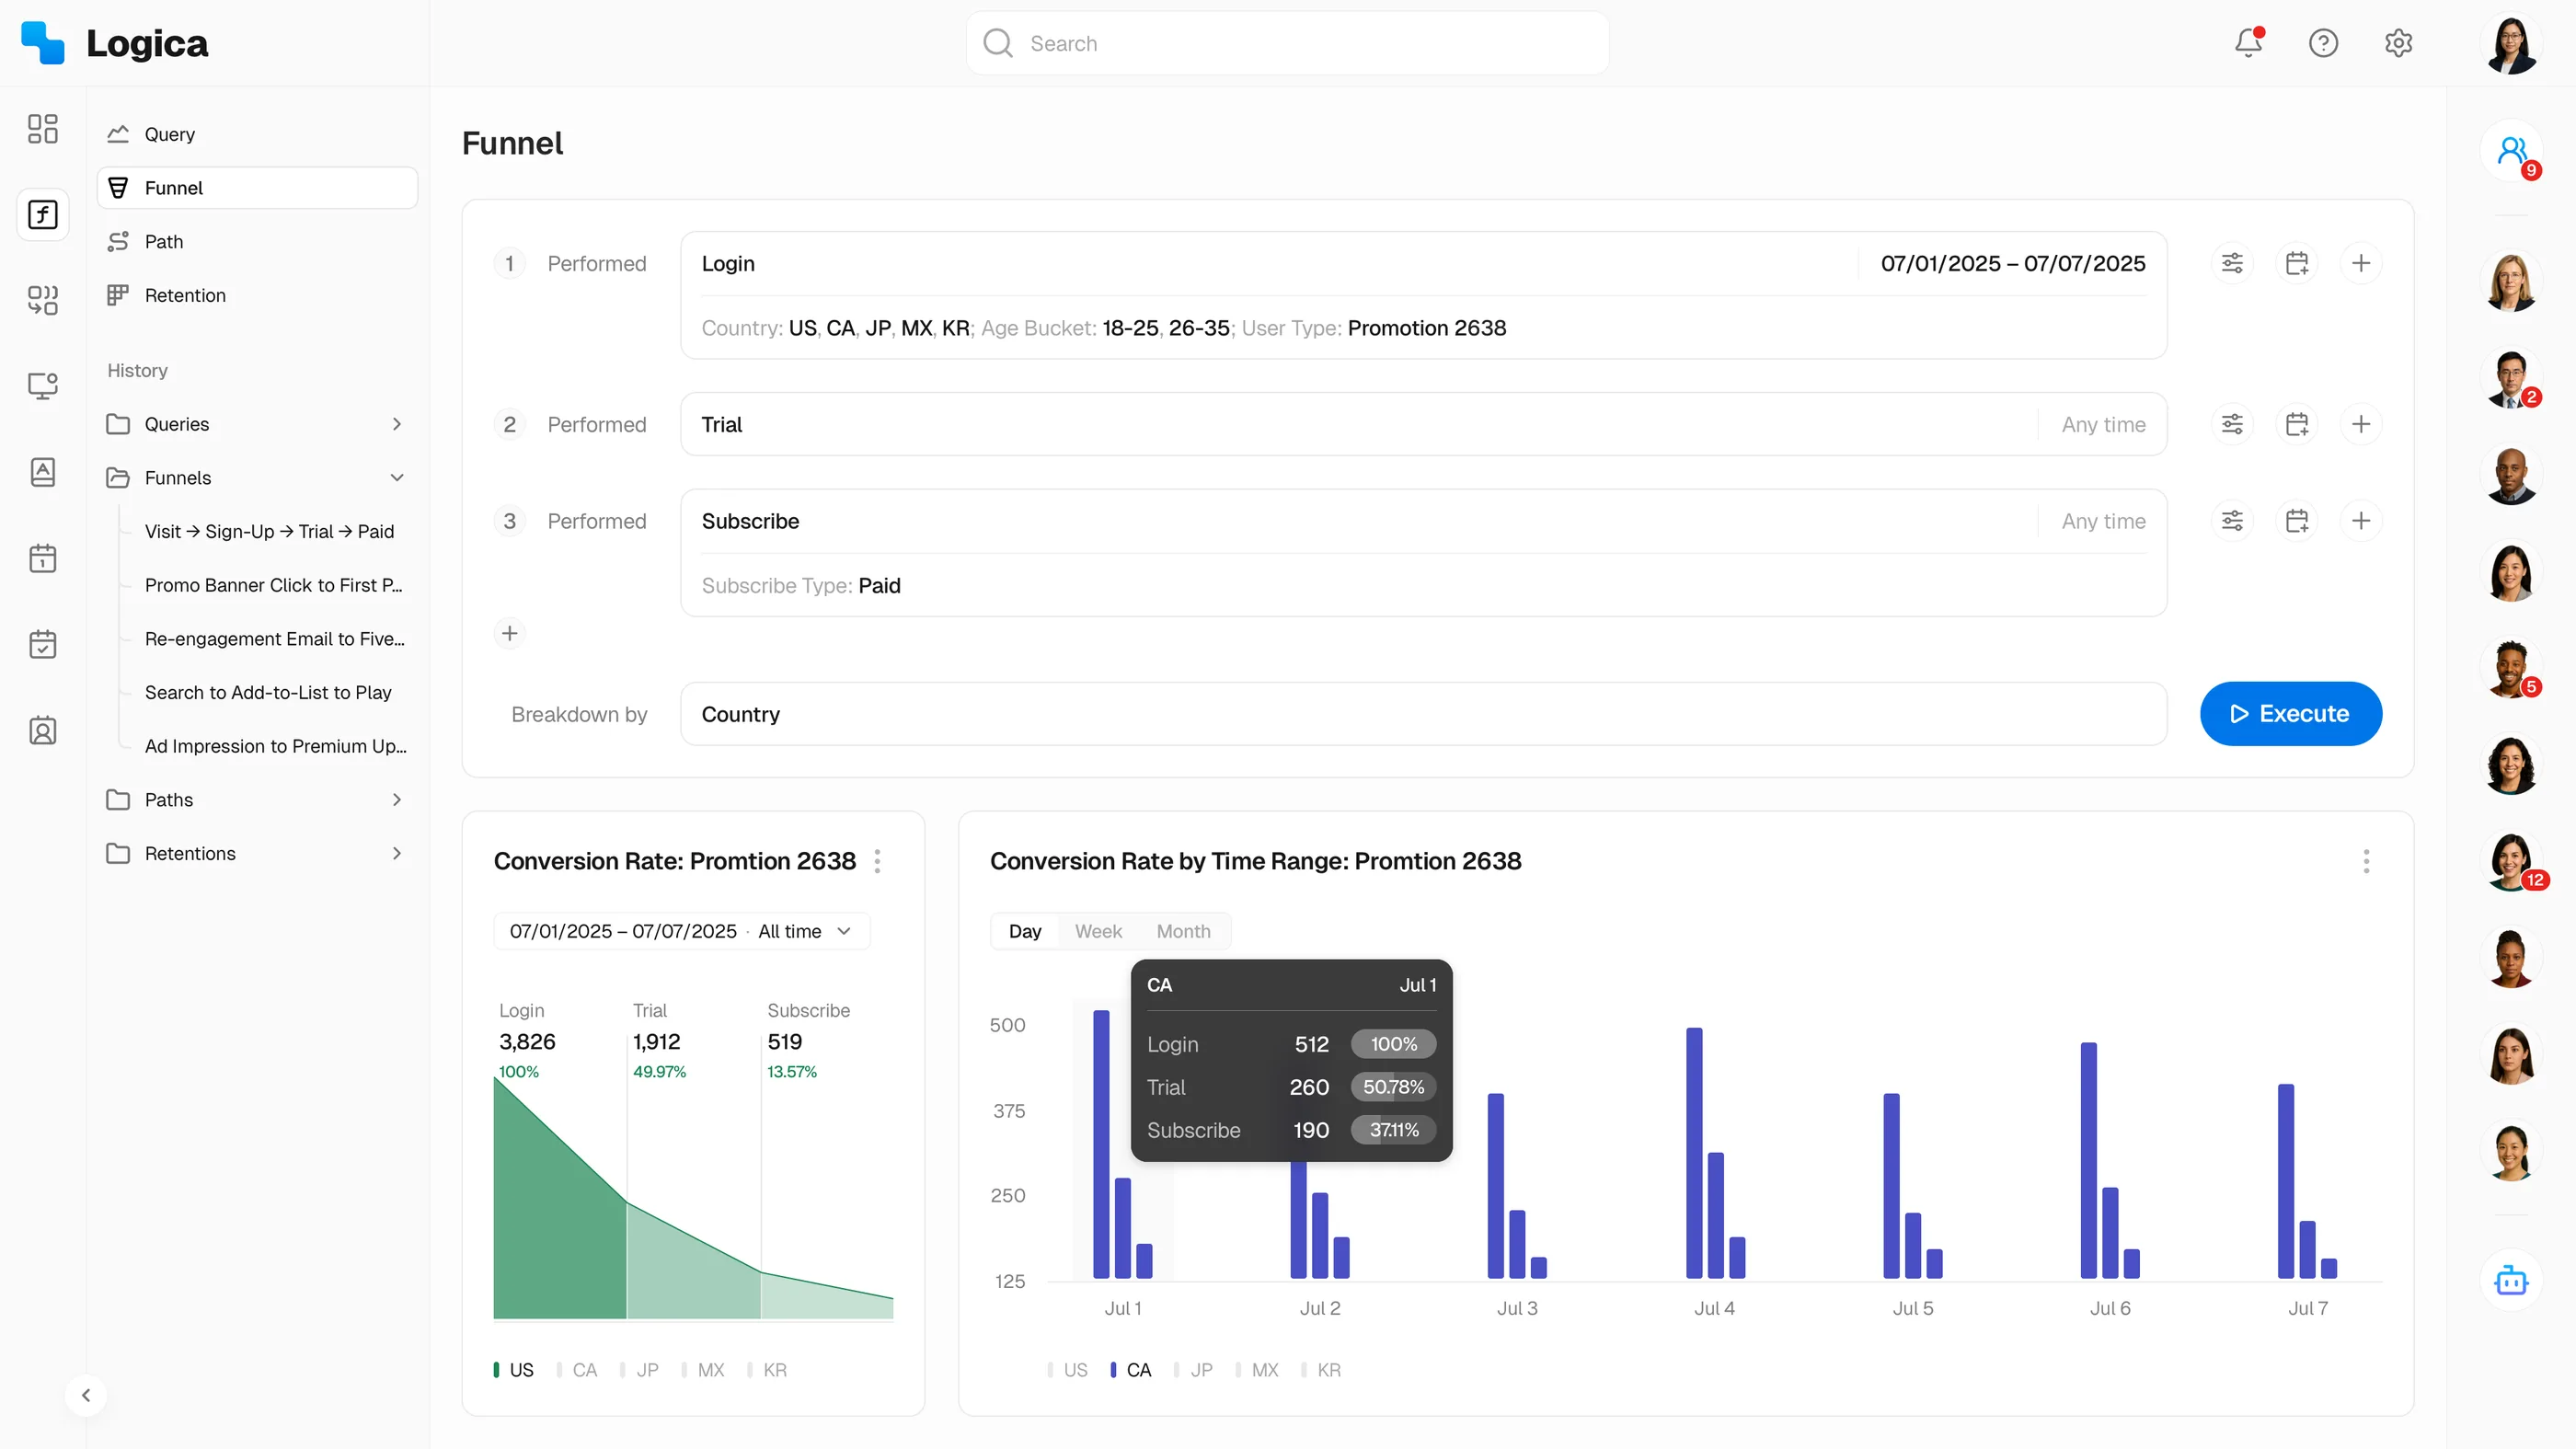
The second call sat in the part of the product where analysts decide whether to trust the tool. The easy path was to hand the editor to engineering and let it accrete features over time. I argued the opposite. The formula editor is where the trust contract with analysts gets written. Autocomplete, syntax highlighting, real-time validation, and a live preview that updates as you type are what decide whether an editor gets used or gets bypassed.
Designing the formula editor end to end was a big part of cutting average analysis time from ~4 hours to ~15 minutes per investigation across enterprise customers. The same metric shows up in the Outcomes section below.
Trade-off 3
Governance vs velocity vs accessibility
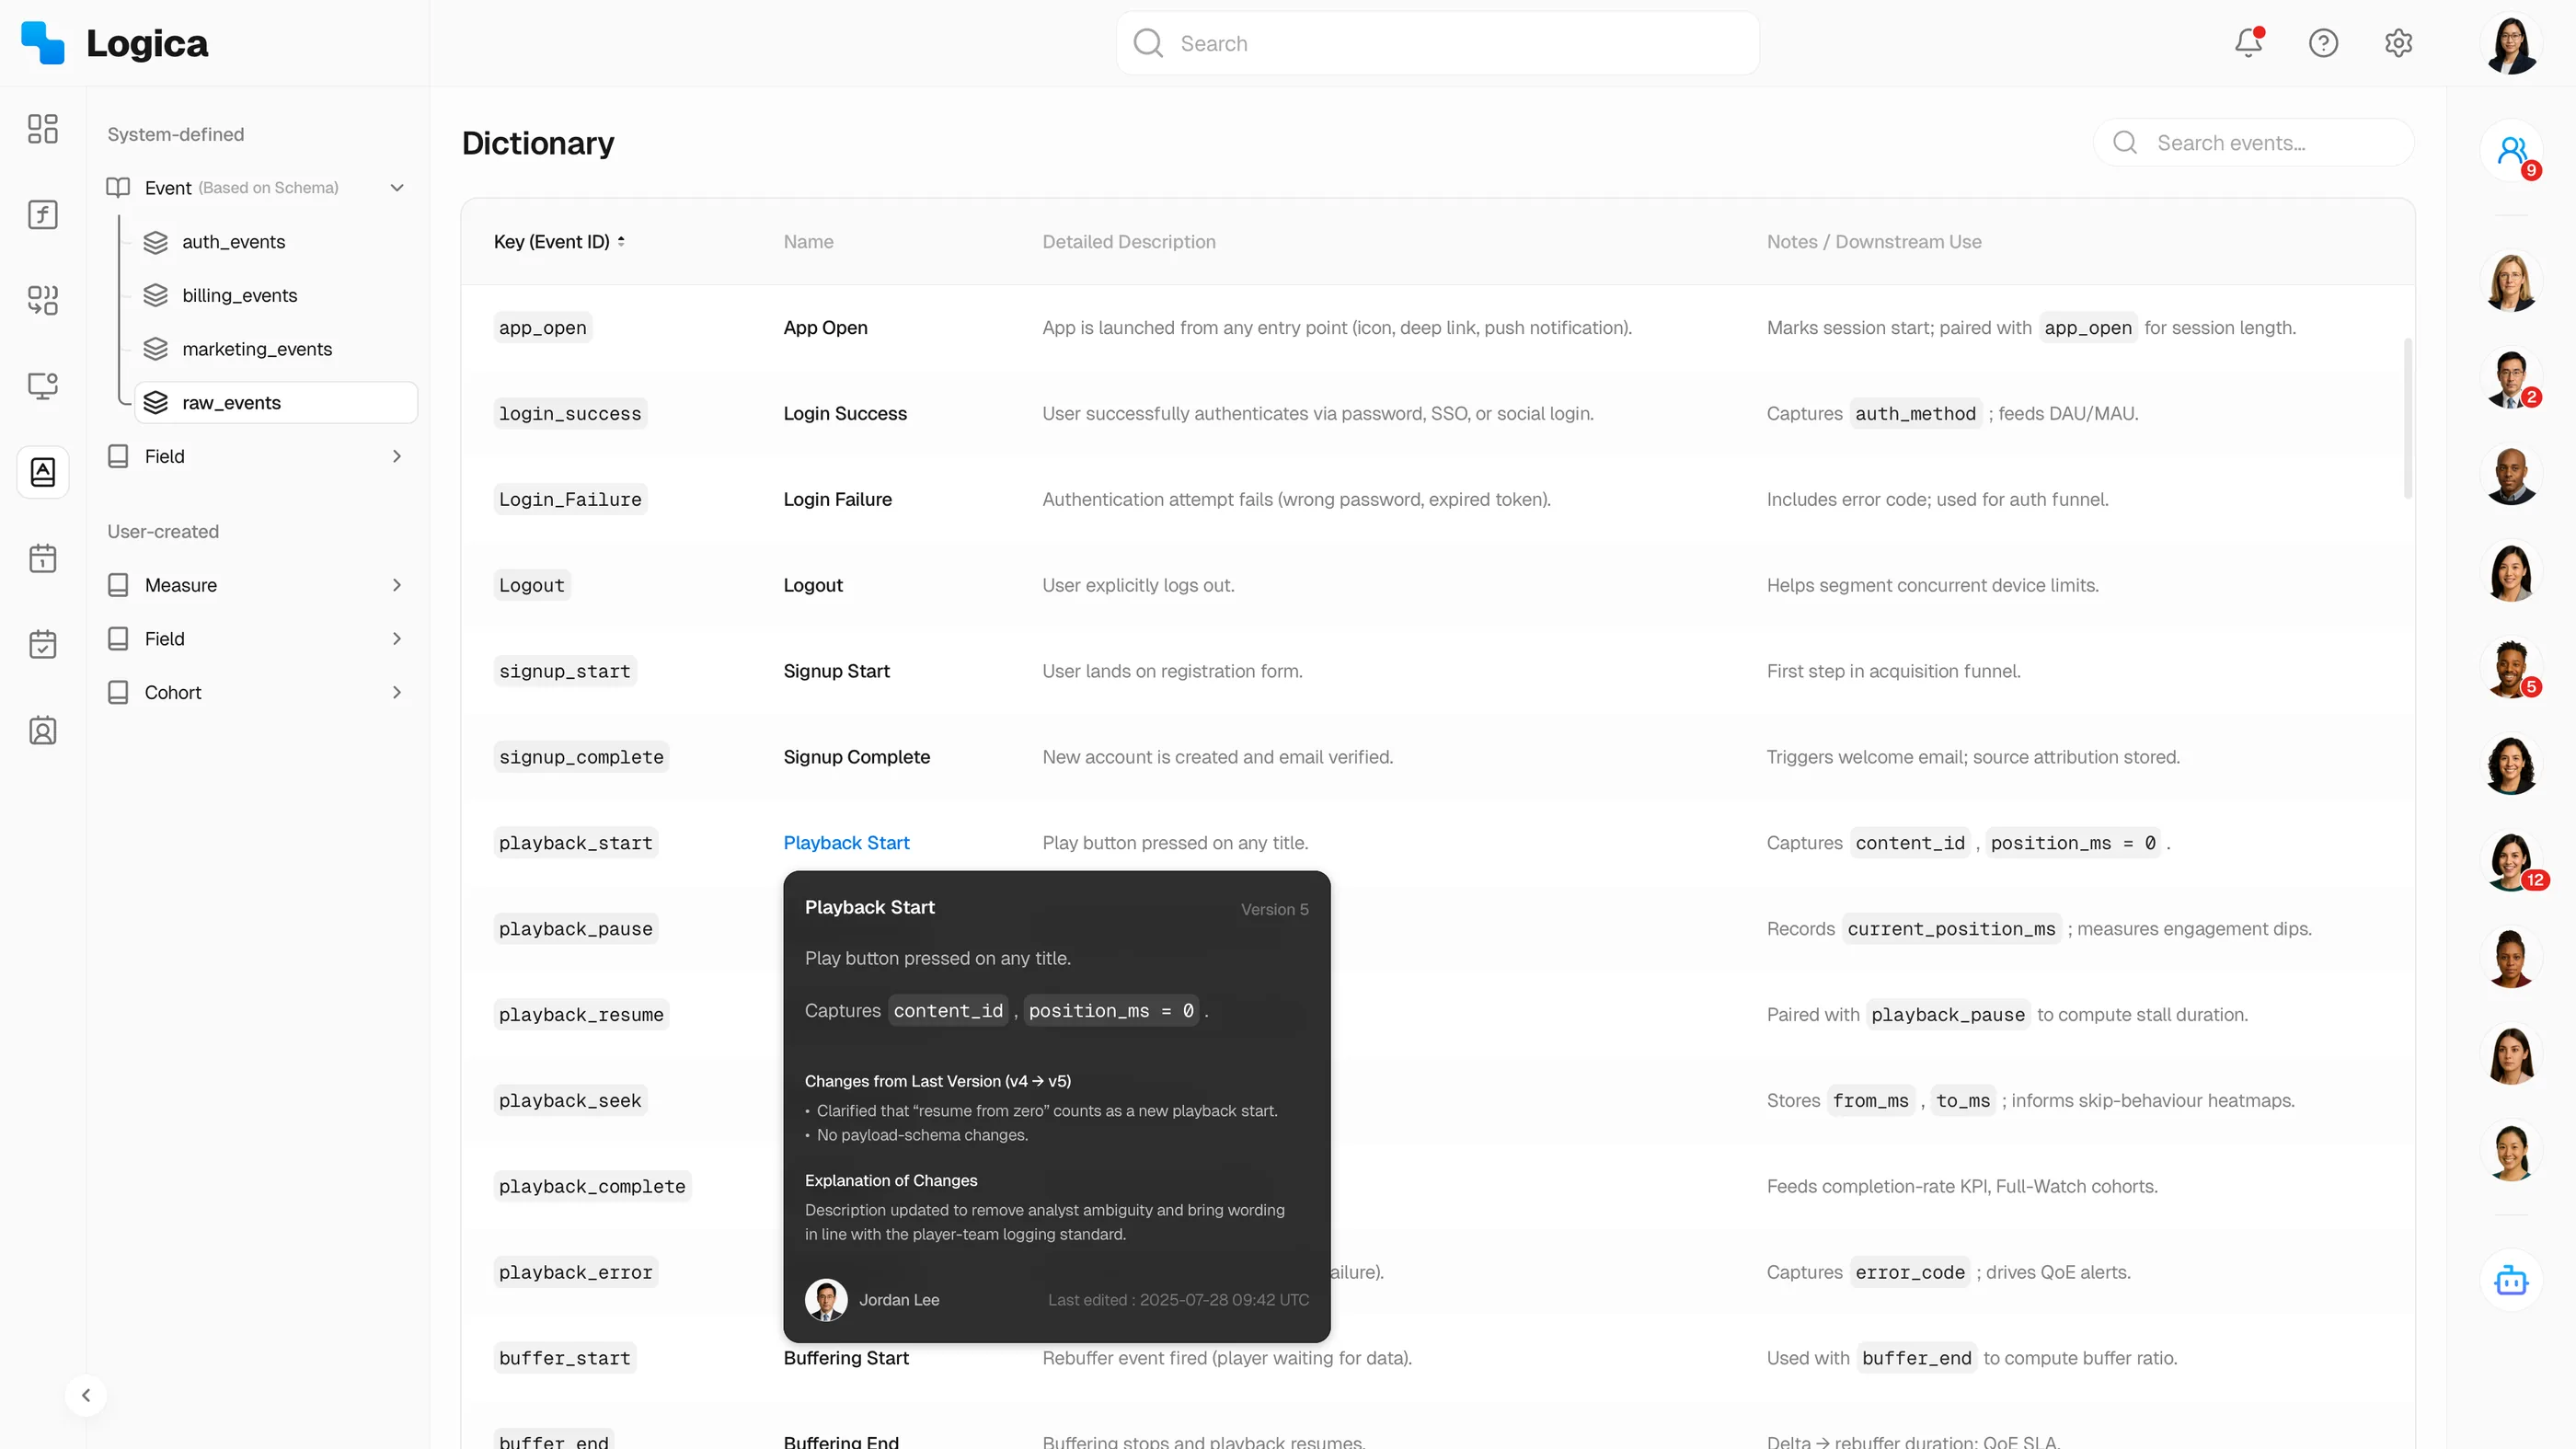
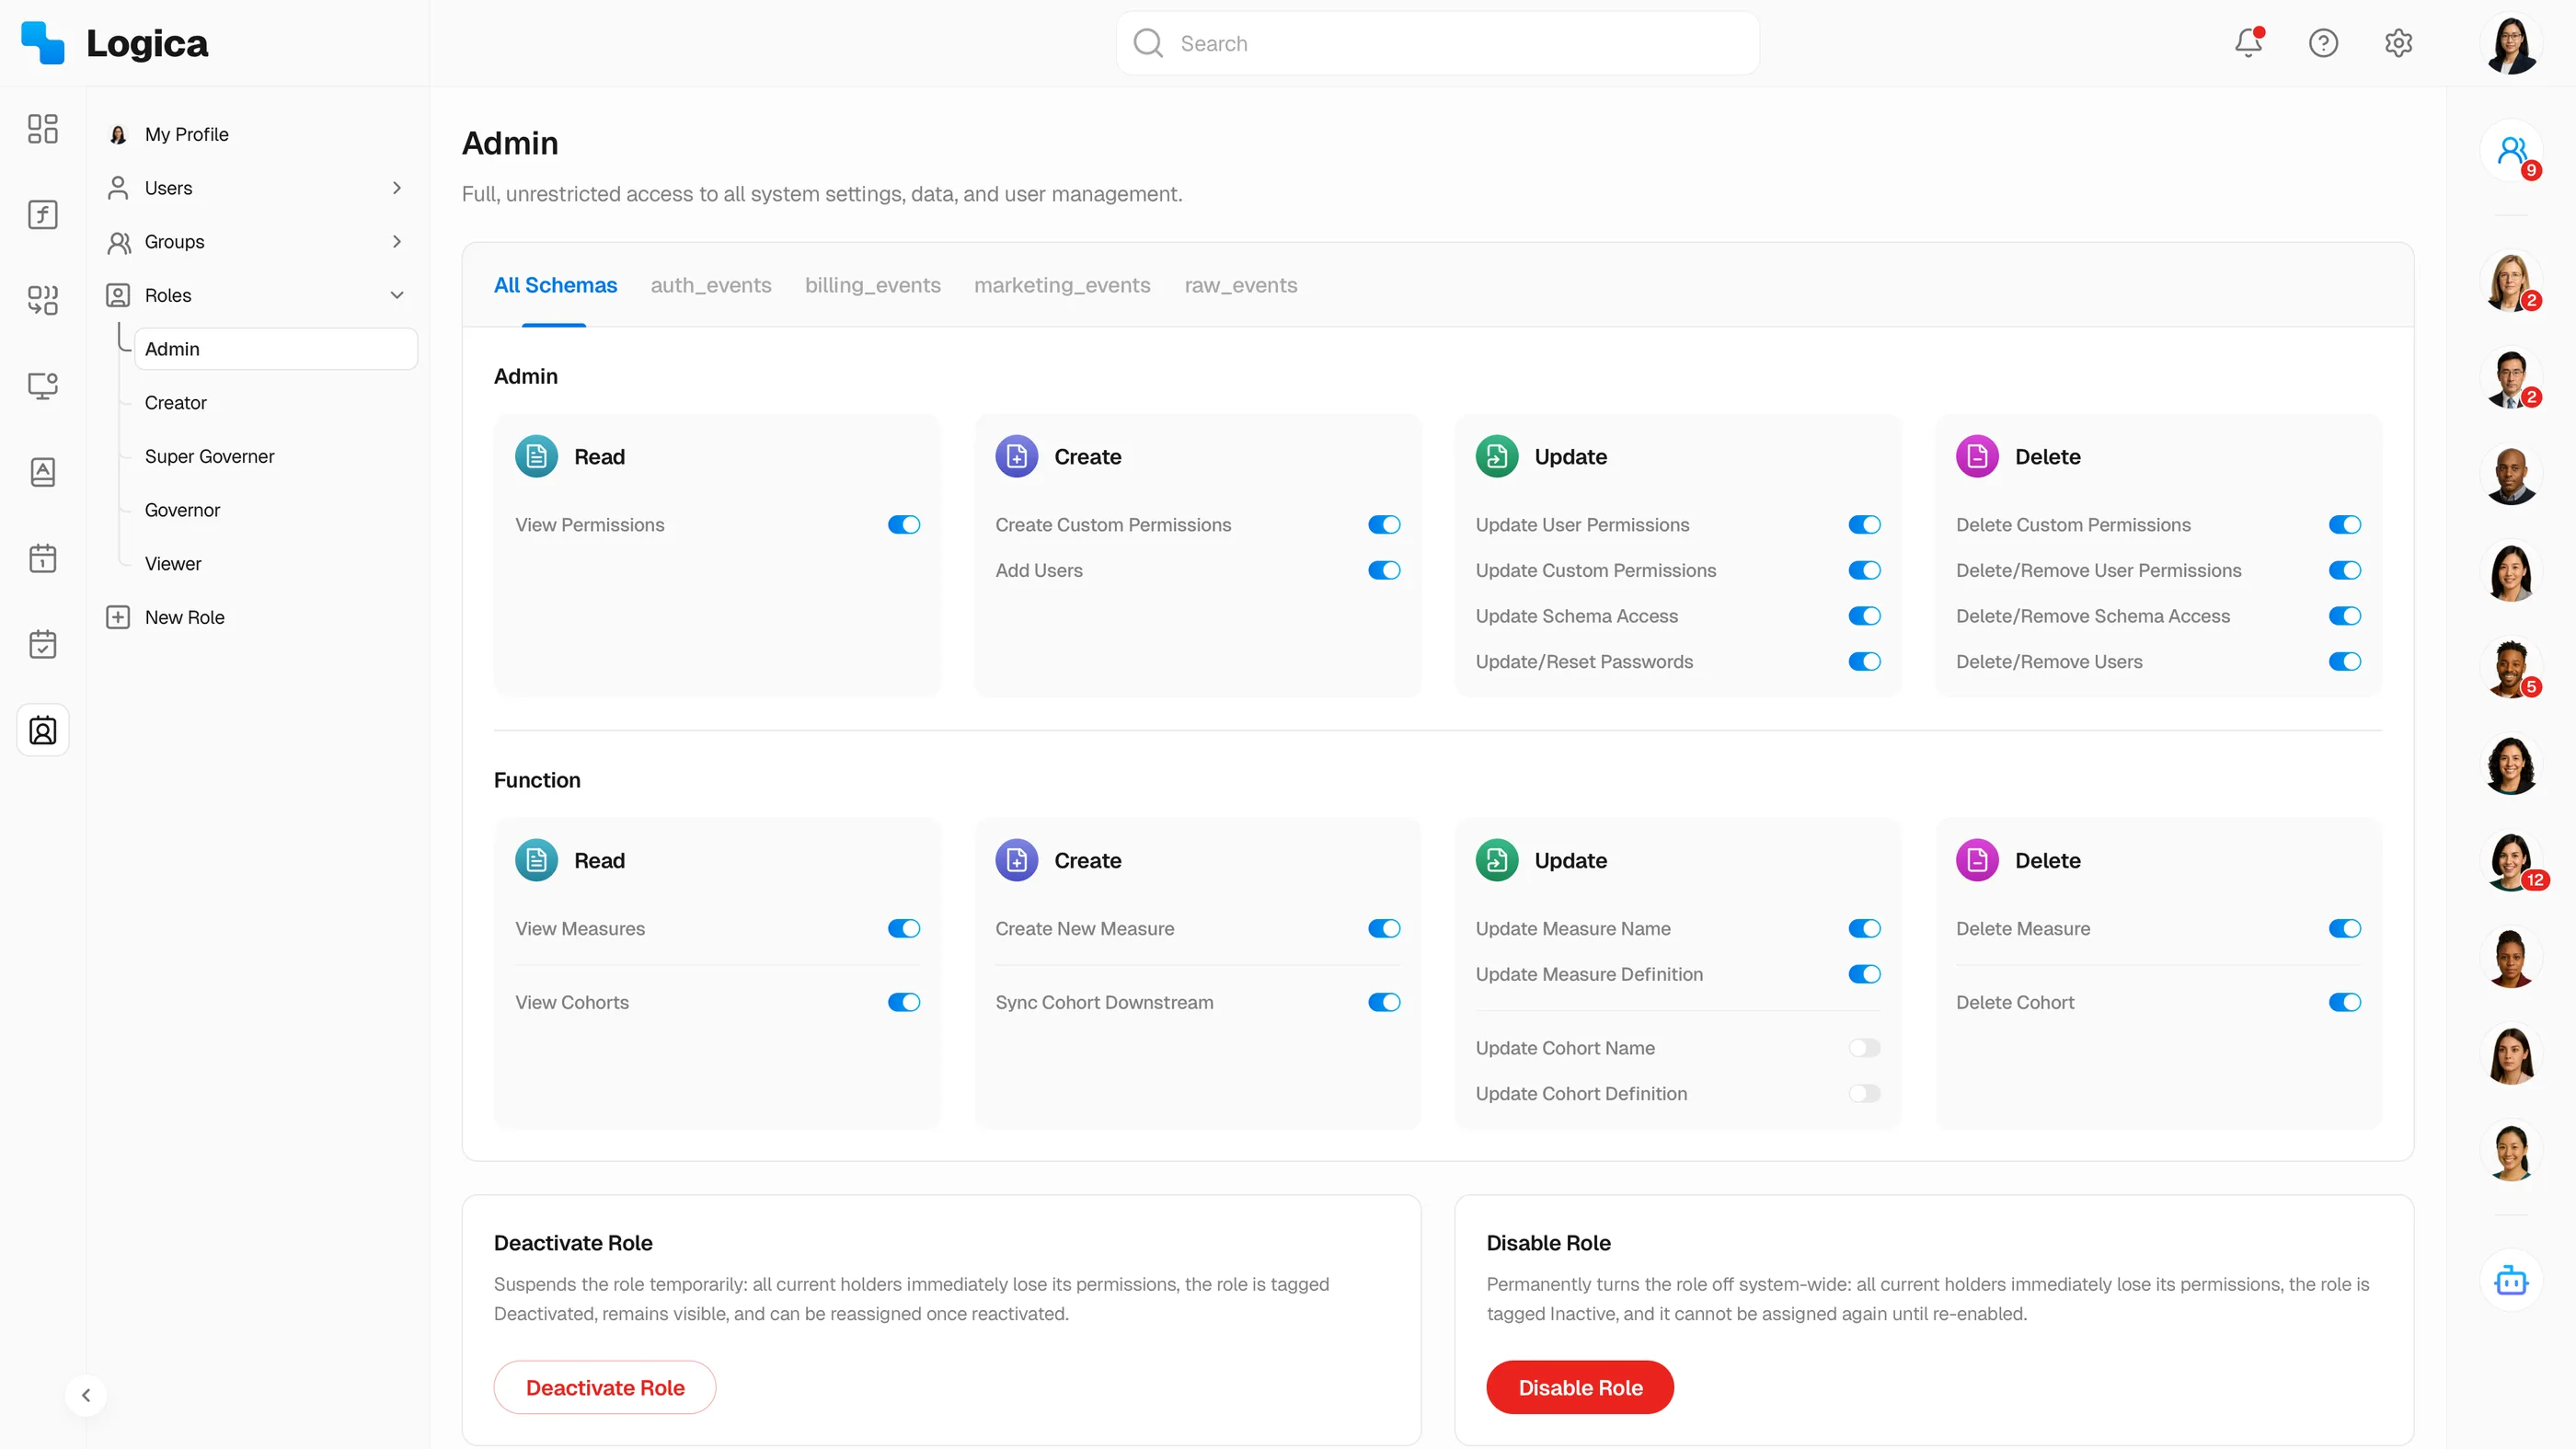
The third call was where to put governance in the launch sequence. Speed to first useful result said “ship the query builder, layer definitions on later.” Trust risk said “uncurated metrics will propagate, and a wrong number on a revenue dashboard is worse than no number at all.” I took the second view and built the metric dictionary as a first-class part of the product. Every event, field, and metric carries an owner, an authoritative description, and a versioned change history.
Inline tooltips brought definitions into dashboards and queries, so teams agreed on one source of truth without leaving the flow. The dictionary is what turned governance from a tax into a feature. Several years later, it gave the natural-language interface (Mika) something safe to ground in.
Designing for the AI-assisted decision loop
Mika: grounding an AI agent in the metric dictionary
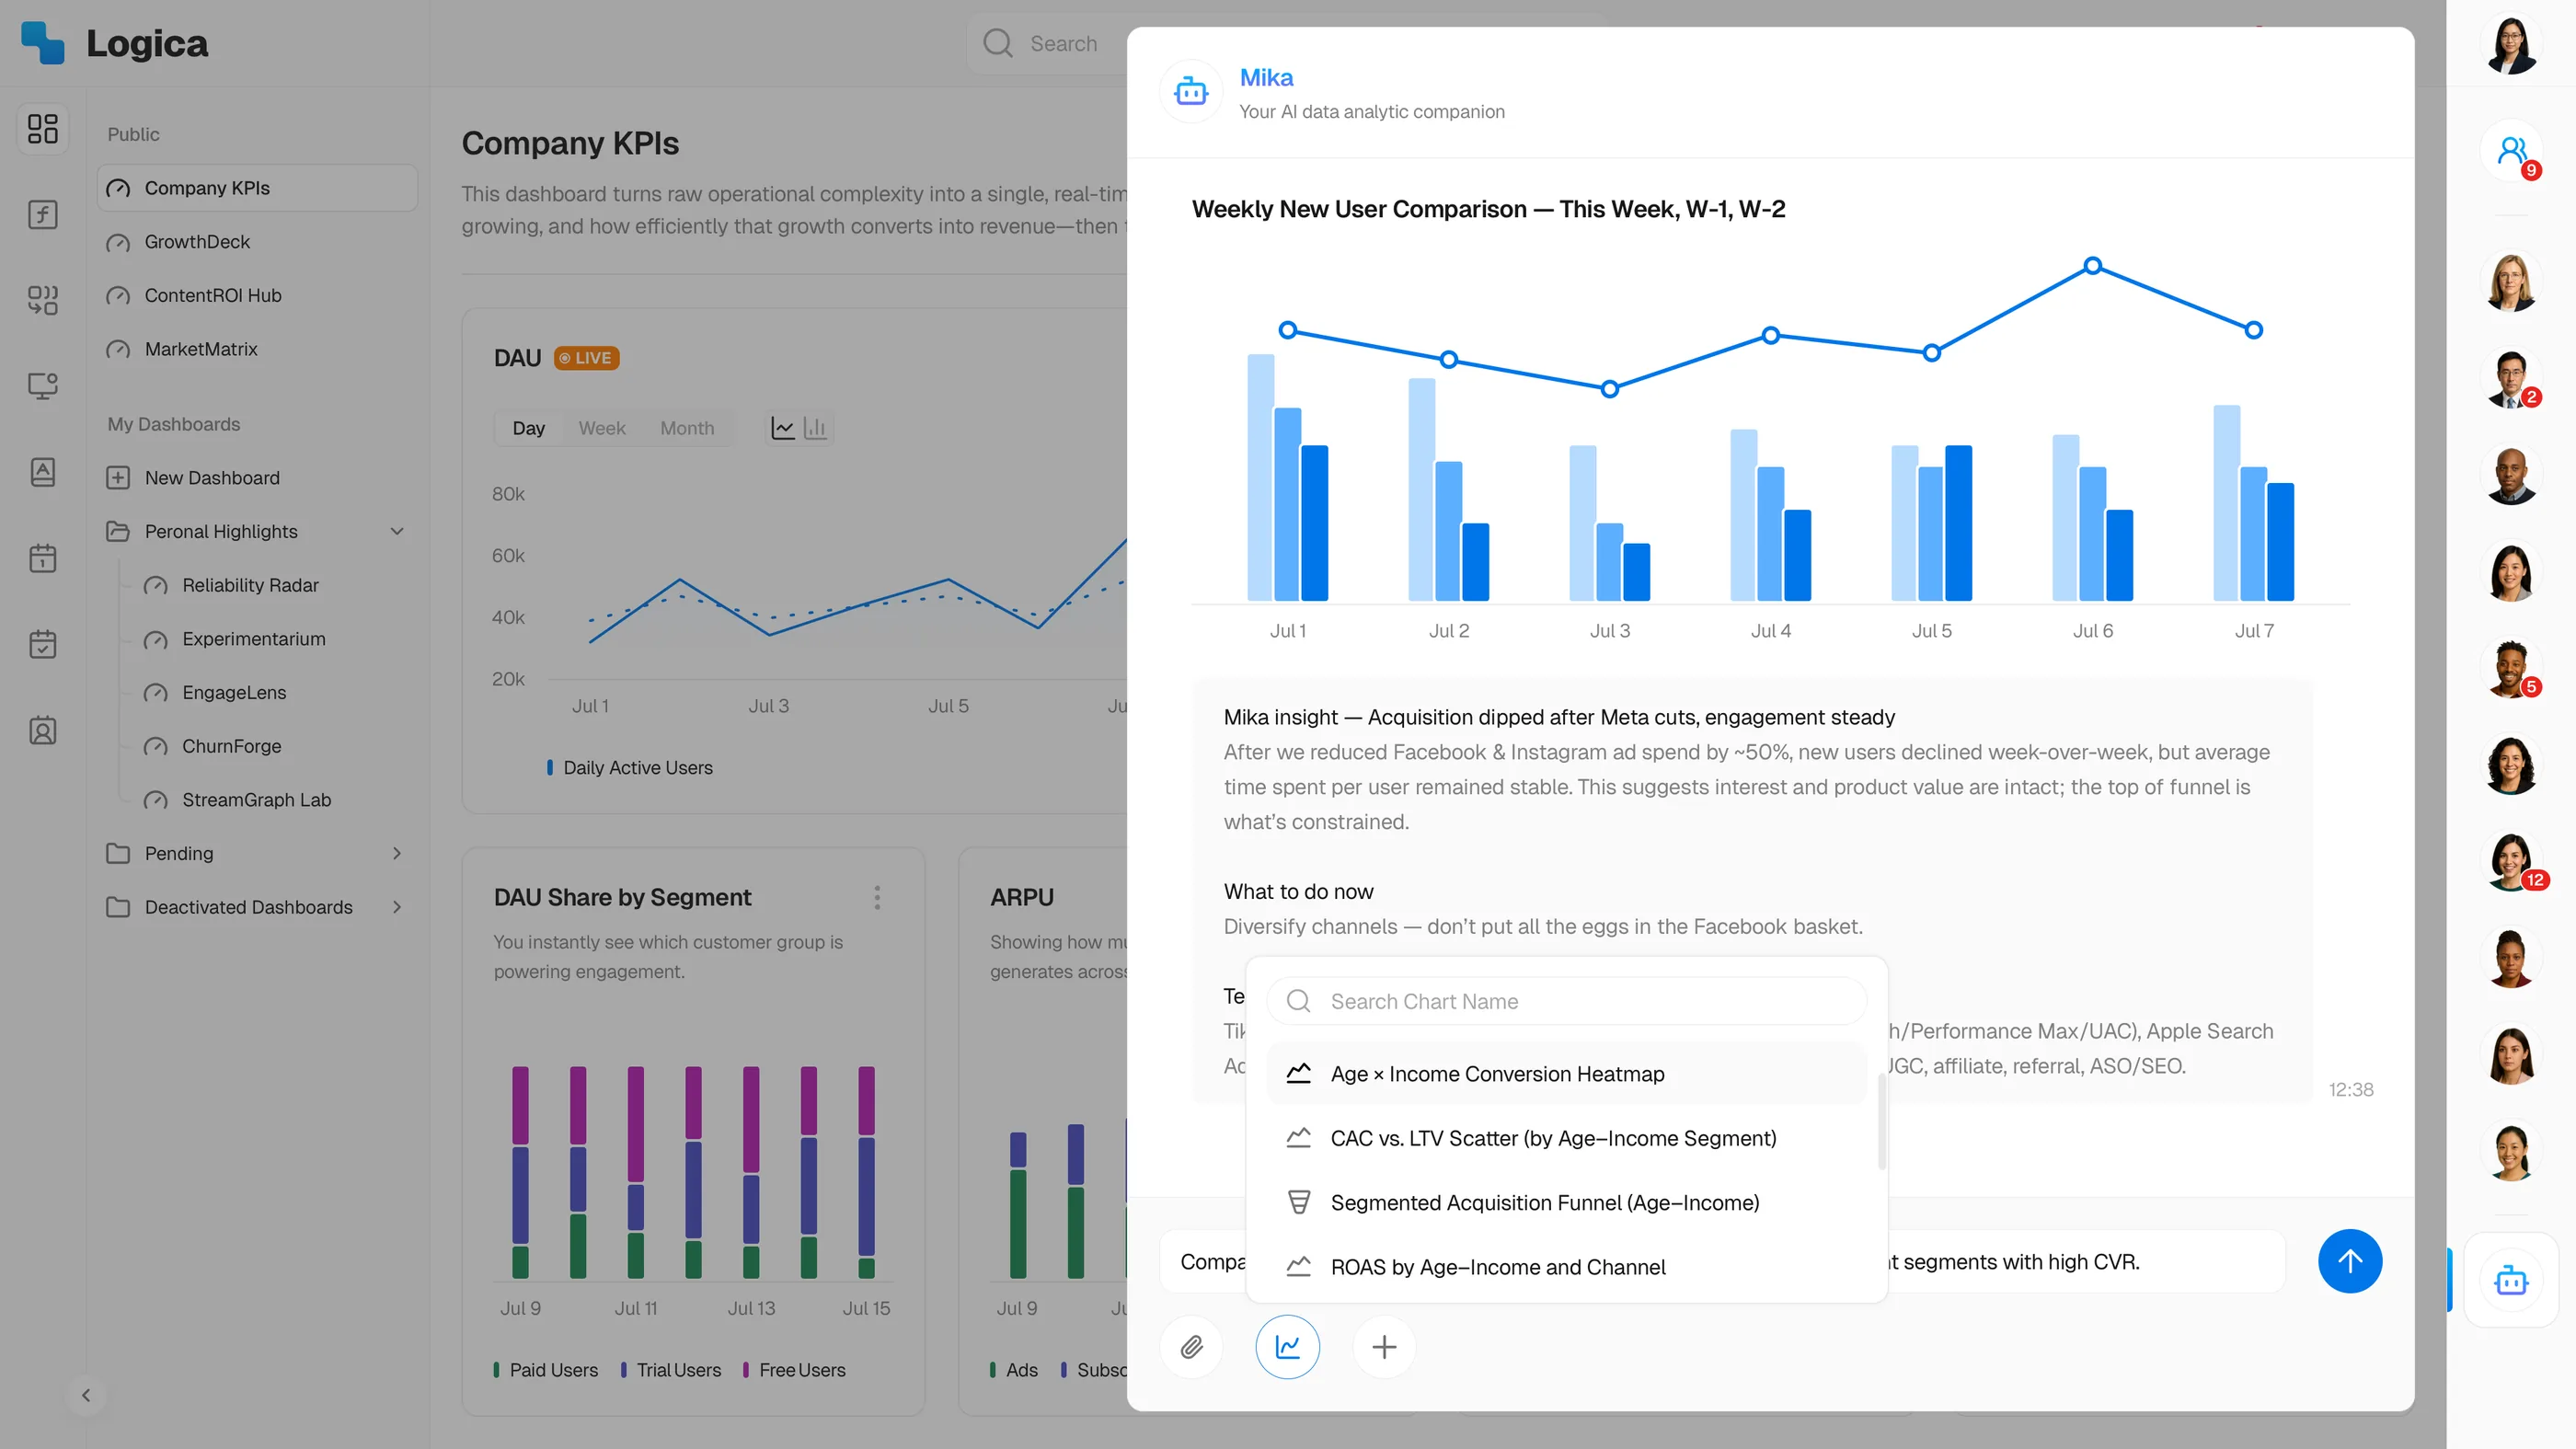
Several years after the formula editor shipped, the same trust contract came up again, this time for natural language. Mika sits inside Logica. I designed it with the ML team to turn plain-English business questions into governed analytics workflows, and it was the work I was most excited to get my hands on: an agent that finally answers in words without quietly inventing what a KPI means. The whole challenge was keeping it honest, grounded rather than freewheeling, on dashboards people bet revenue on.
The trade-off was real. Let the model freelance for a faster prototype, or constrain it to dictionary-defined metrics, slower but trustworthy on a revenue dashboard. I constrained it. Mika answers are grounded in the metric dictionary. Suggested charts surface the dataset window, the definition path, and a confidence cue. Abnormal answers hit an Accept / Edit / Regenerate gate before they enter a shared dashboard.
It’s the same Draft → Review → Accept pattern I later worked through in detail on the Aegis Clinician concept; the AI-credibility problem keeps the same shape across domains.
More of what shipped
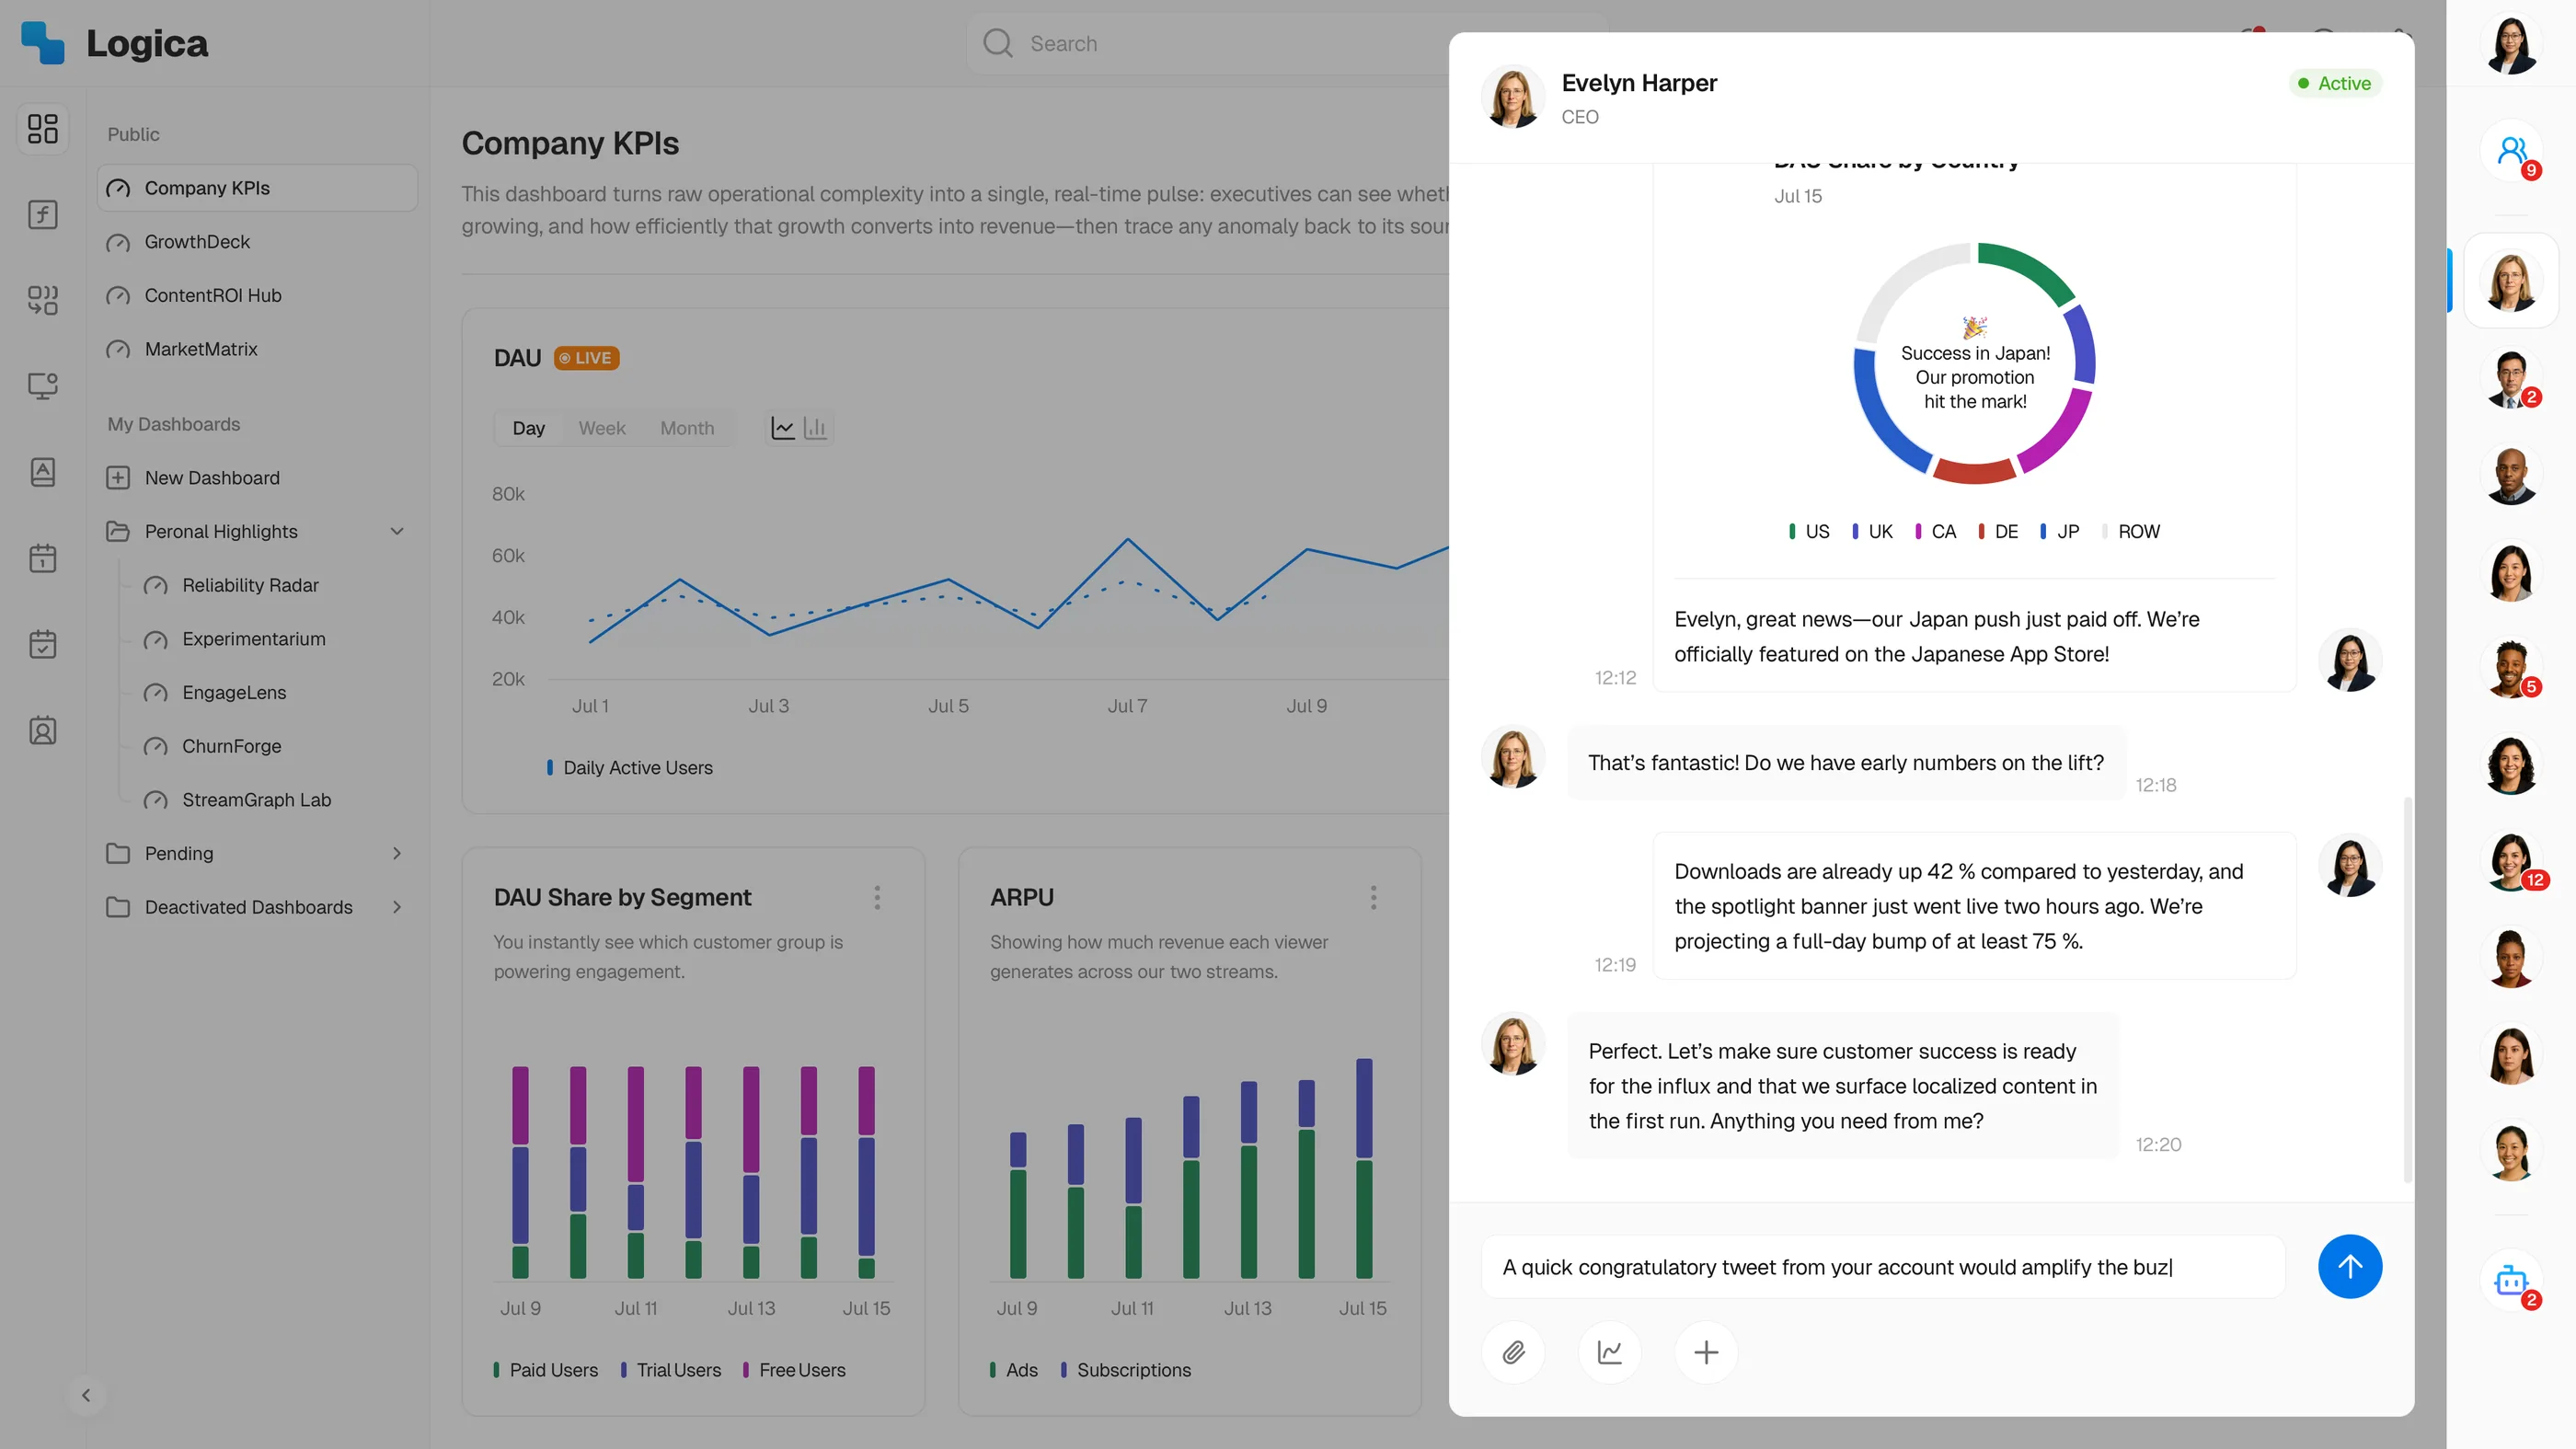
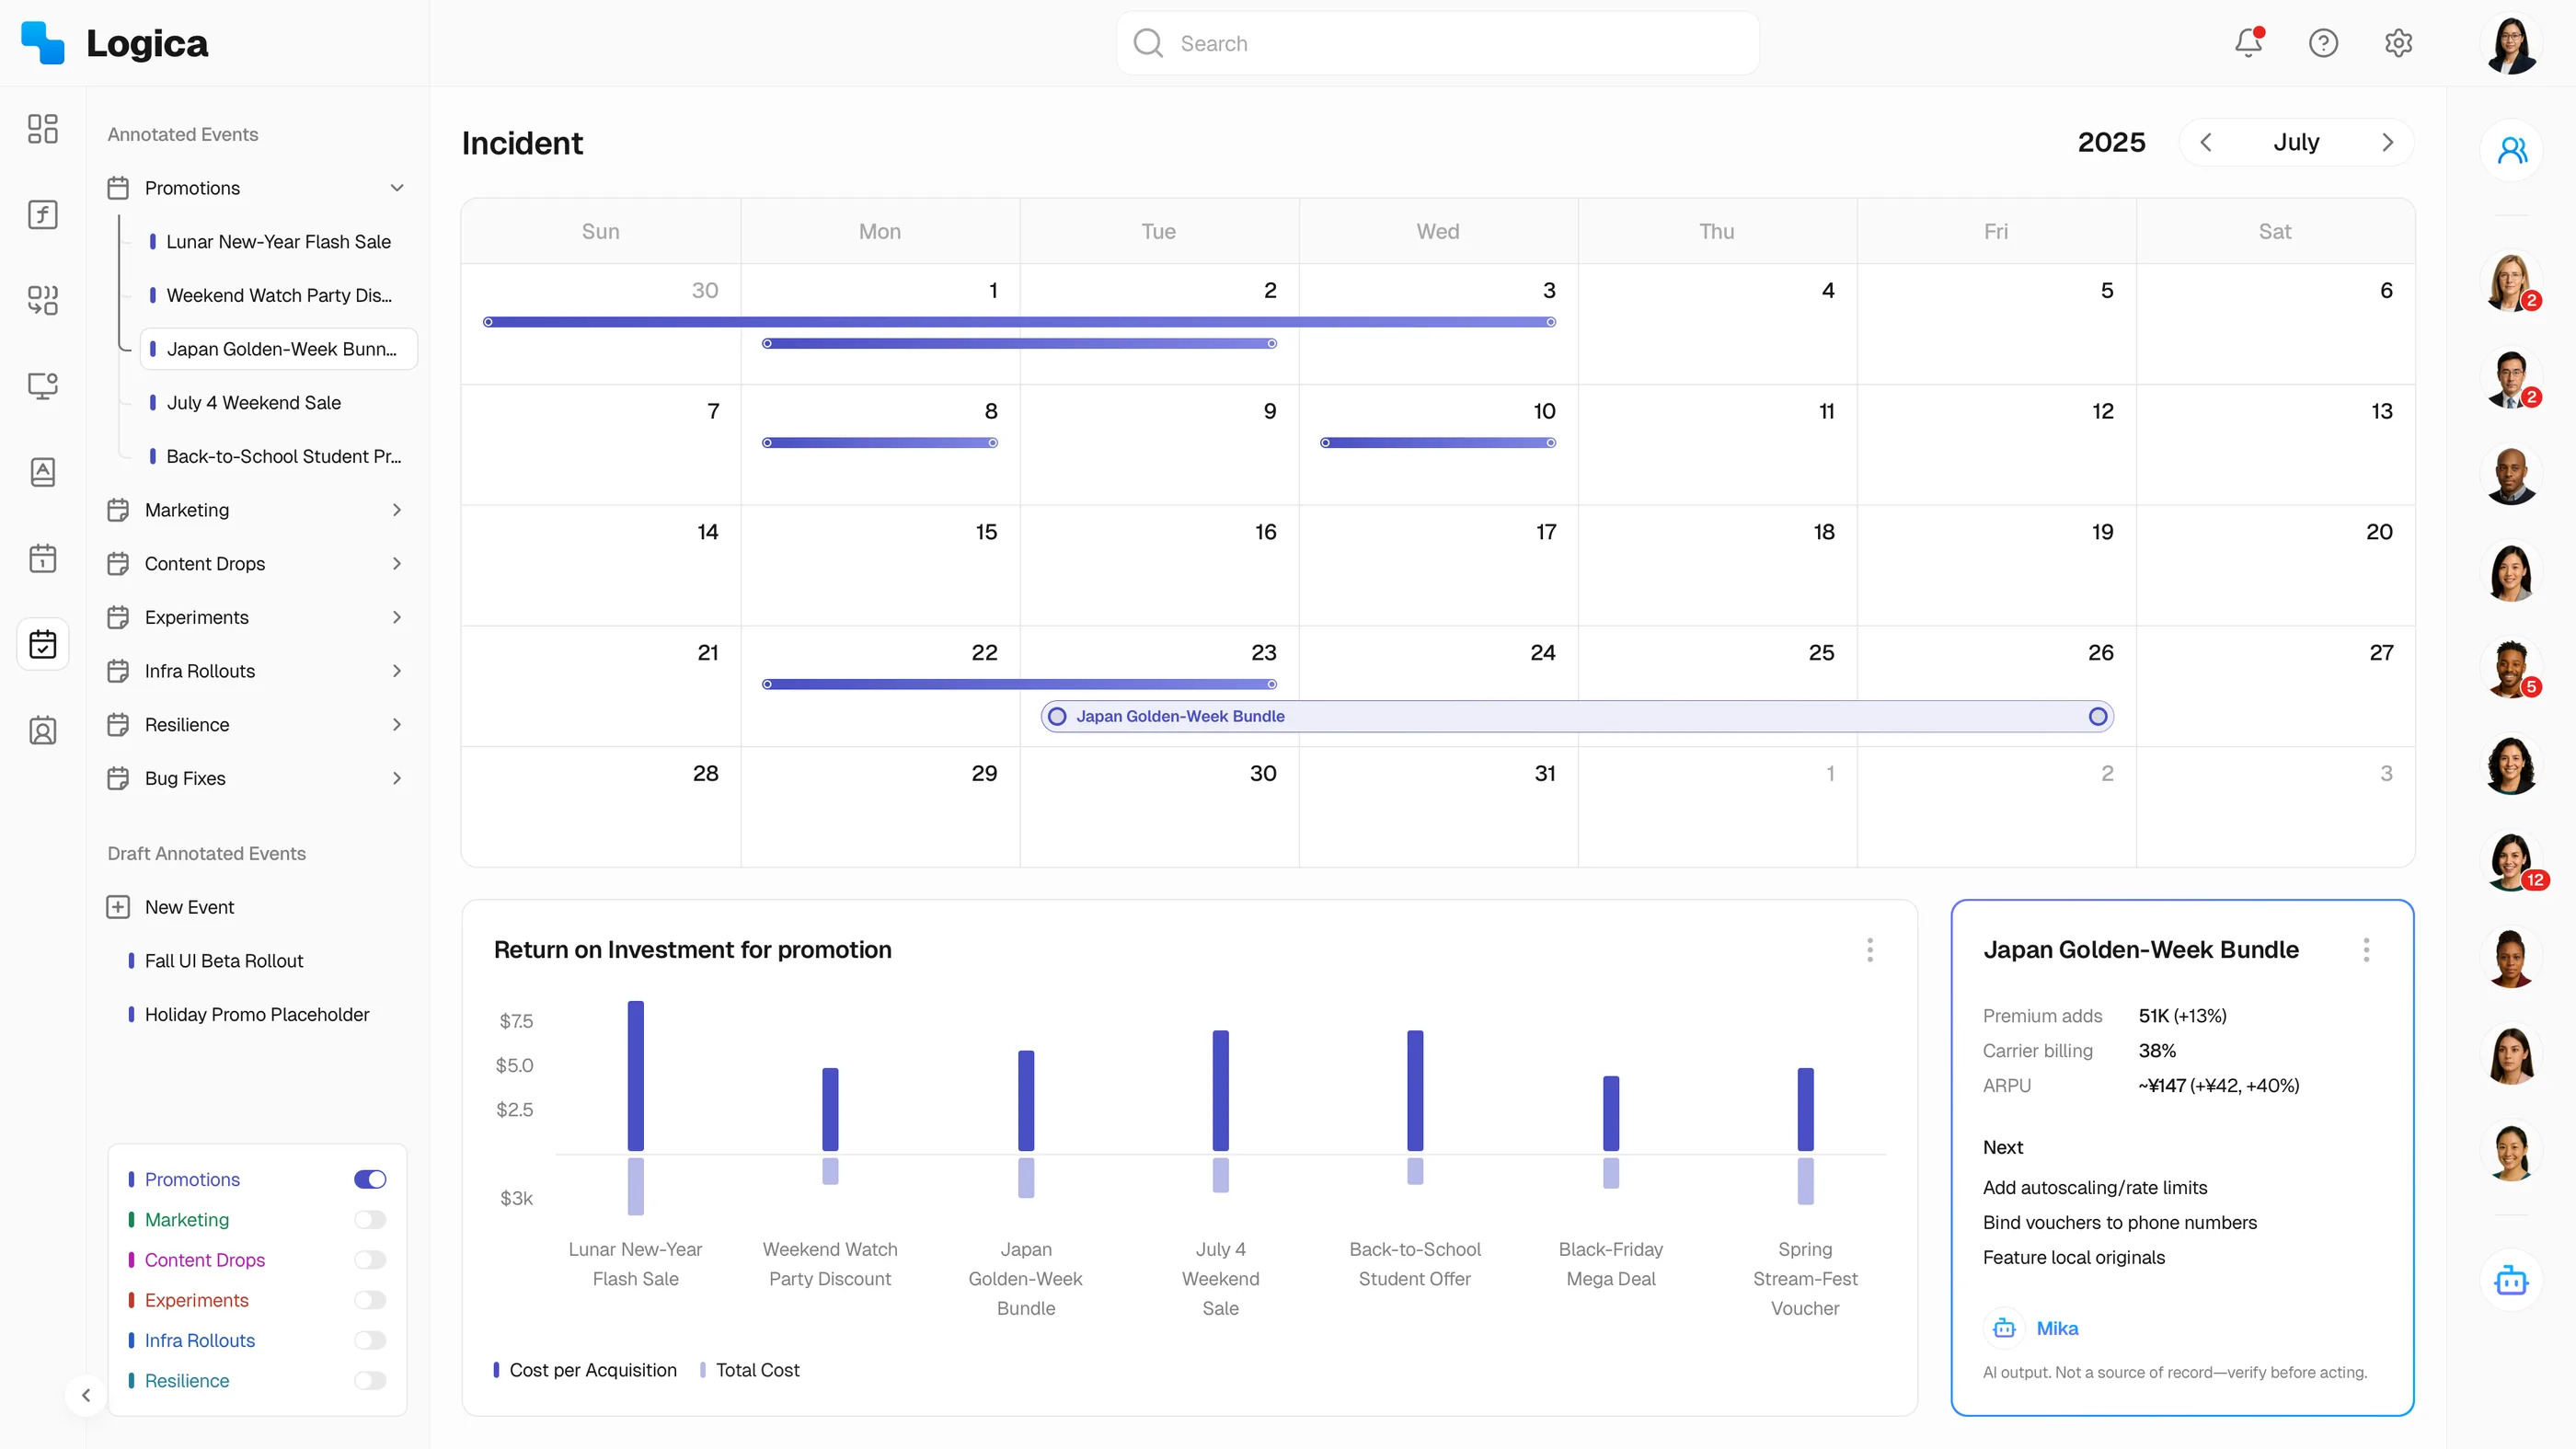
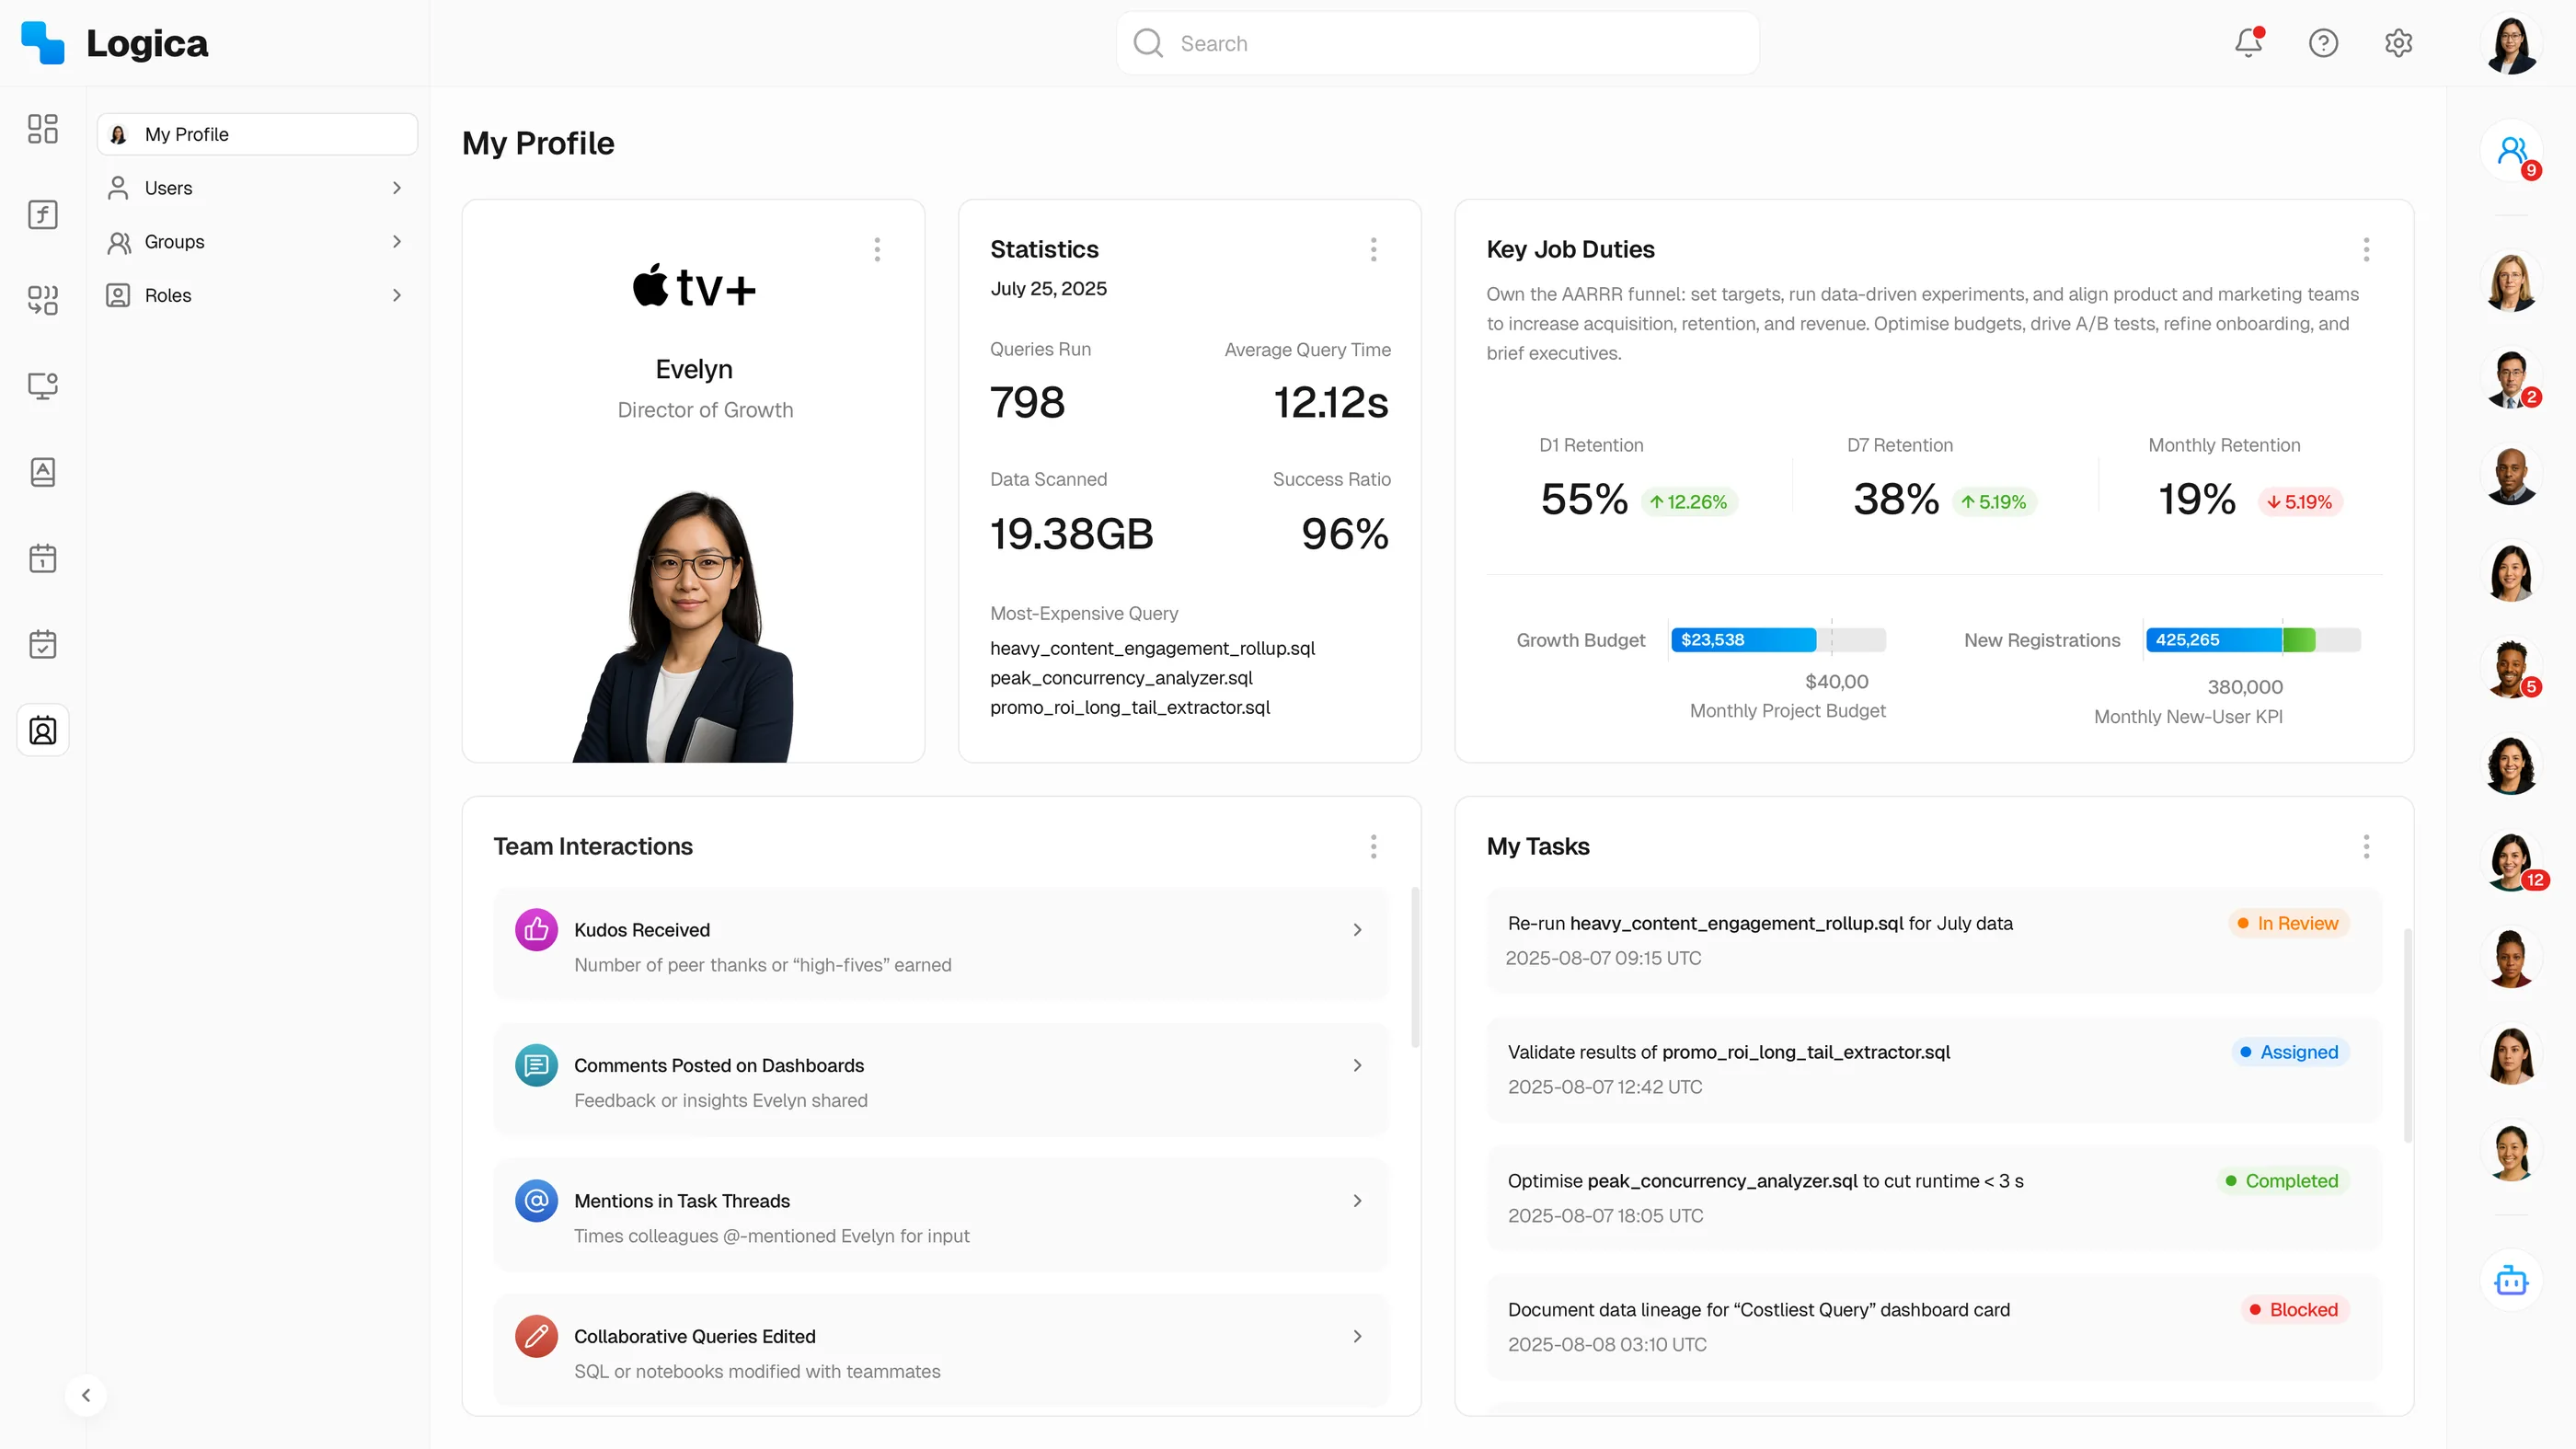
Real-time dashboards, incidents, workspaces, and admin
The screens below show the rest of what shipped: collaboration timeline, incident calendar, personal workspace, and admin RBAC. What ties them together is provenance. Every artifact, whether chart, query, comment, or incident note, carries an owner, a timestamp, and a permission gate before it lands on a shared dashboard.
Outcomes
The speed is why customers stayed
- 0 → $4M ARR over 6 years. Founding Designer · 5 years solo designer · coached 1 junior designer + 2 interns · Kubit AI · Nov 2018 – Nov 2024.
- ~4 hours → ~15 minutes per investigation. The formula editor, multi-tenant workspaces, and role-based permissions cut average investigation time across enterprise customers.
- 15+ enterprise customers · 85% logo retention. Including Samsung, Pluto TV (Paramount), and Vix (TelevisaUnivision).
- Design system supporting a 50-person product team. Tokens, components, and governance patterns that cut front-end implementation time roughly 40% over its lifetime.
What I’d do differently
Reflection
The dictionary should have shipped before the formula editor, not alongside it. Several enterprise customers built workflows on pre-dictionary metric definitions, and retrofitting governance after the fact cost more than holding the editor for one quarter and leading with the dictionary as the launch foundation would have.
The second one: I would have invested in the AI-assisted chart grounding pattern earlier. By the time Mika shipped, the hallucination question was acute industry-wide. Doing that work in 2022 instead of 2024 would have given Logica an 18-month lead on the obvious follow-up, “what does AI-grounded analytics mean?” That timing trade-off is the one I think about most.
The system underneath
The components that supported a 50-person team
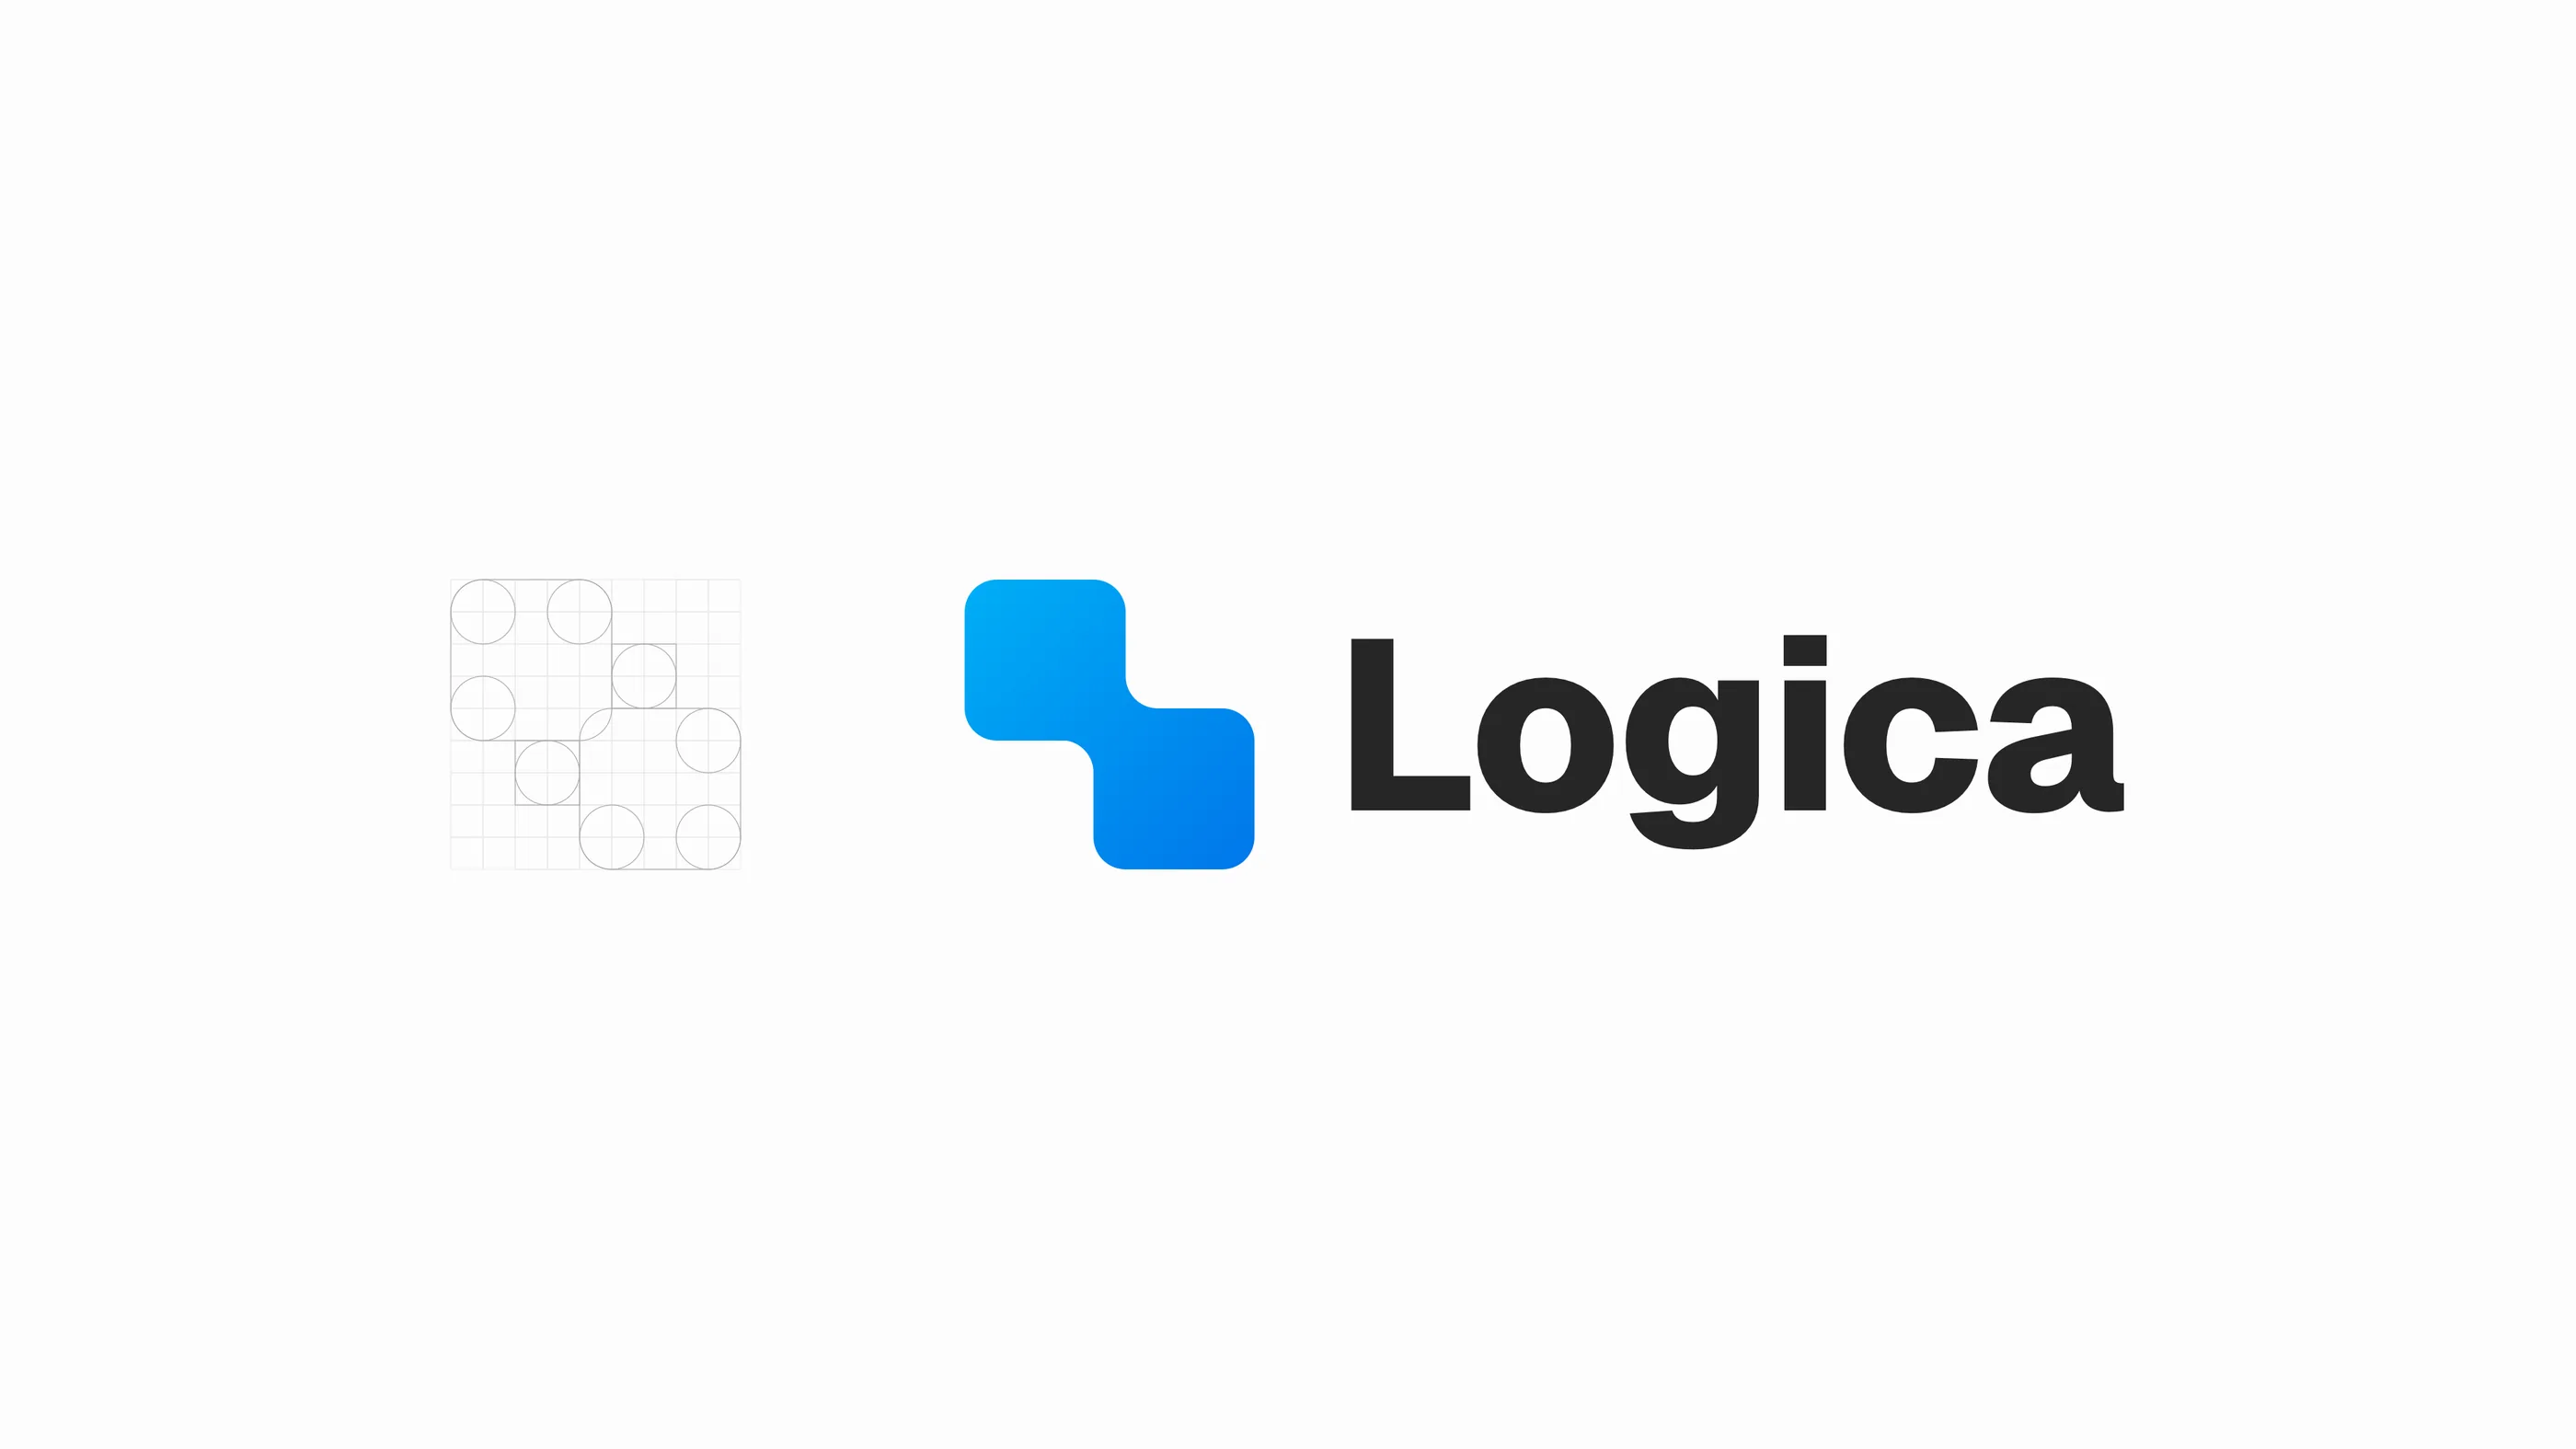
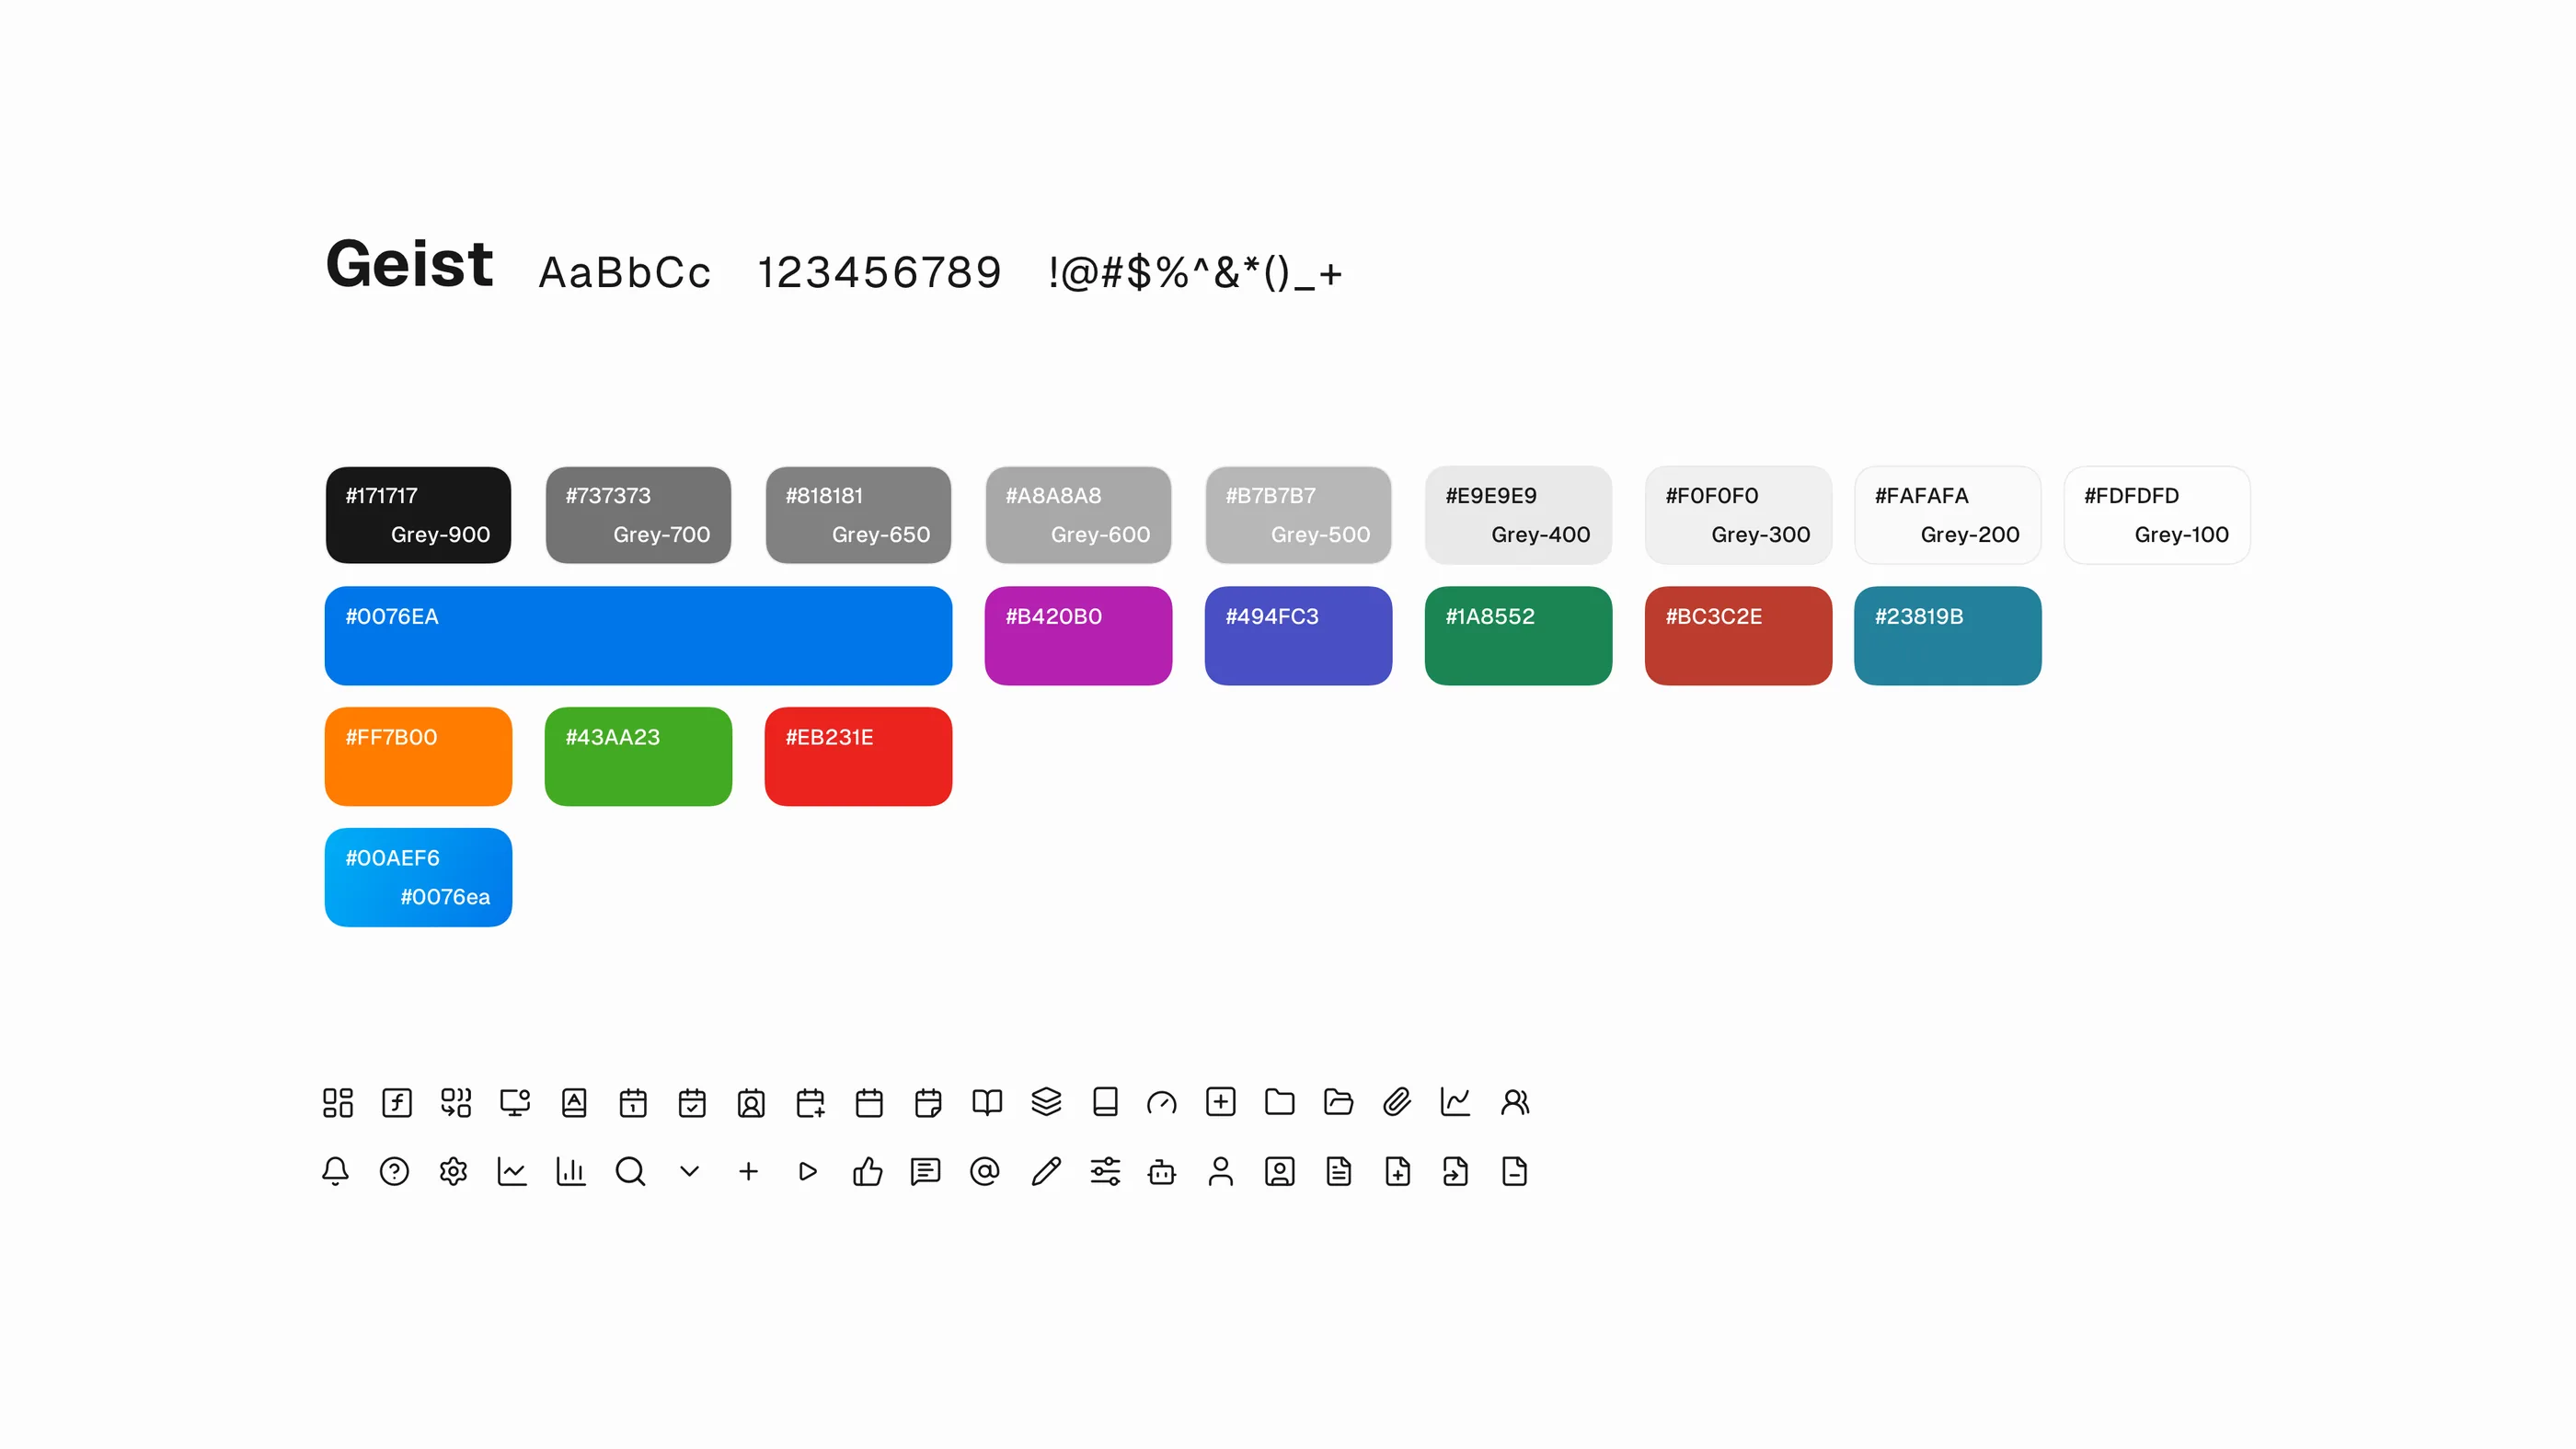
Supporting a 50-person product team as the solo designer for five years, then coaching one junior designer and two interns, only works if the system does most of the work. The 40% front-end implementation reduction listed in the Outcomes section above isn’t a separate claim. It is the evidence behind the system decisions above: a refreshed mark, accessible color tokens, a modular UI kit, motion rules, and accessibility patterns. Product, marketing site, and launch materials stayed aligned across years and surfaces because they all pulled from the same library.
The reusable components carried the governance patterns (permission matrices, audit-trail rows, dictionary tooltips), so a new analyst-facing tool inherited the dictionary’s trust contract on day one without re-litigating it. The identity layer is what made the rest of the case possible. It was never a brand flourish on top.
What I carry forward
Governance drove adoption more than any new chart type. Every analytics product he designs now starts with permission clarity, then feature depth.